Look at it grow
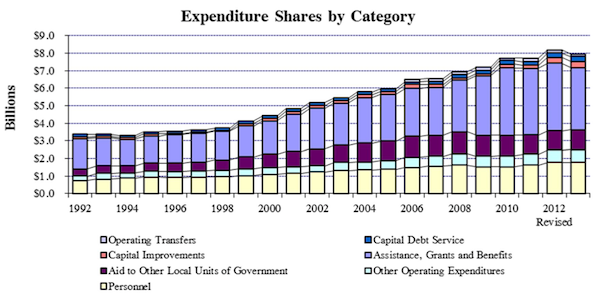
So what’s in the state budget? Funny you should ask. In the accompanying chart, you can see the breakout in a graph prepared by the House Fiscal staff. They publish a digest of the budget every year that is pretty helpful in figuring out what’s going on. What you can also see from the graph is how the budget has grown in 20 years.
What you see looks like huge growth, and if you compare it to the inflation rate over those 20 years, it seems to confirm what everyone says, that government spending is out of control and so on. You know how that song goes.
In fact, there are some serious problems in government spending, but they’re pretty specific and we’ll get to them. But first, let’s talk about inflation. The inflation rate is calculated based on a household’s expenses, and it looks at the rise in prices of the things that people buy: groceries, gasoline, auto insurance, medical services, TVs, washing machines, and so on. Your state government does not actually buy a lot of groceries, and I’m betting that you do not buy a lot of services from corrections officers or park rangers. That is, there’s no reason to think that the inflation rate tells you anything useful about how much government spending should grow.
What’s really at issue in questions like this is whether the taxes the state levies are weighing down the state’s economy. If taxes are soaking up a bigger proportion of the state’s economy than 20 years ago, that’s not good news unless we’re getting a lot more services. So what’s the story?
In 1992, the state collected $1.74 billion in taxes, and the state’s economy (measured by personal income reported by the BEA) was about $21.1 billion. So the state collected taxes equal to 8.25% of the overall economy. Using the 2011 BEA income number and the economic predictions in the budget [on budget page ES-13] we expect personal income in 2013 to be about $49.7 billion, out of which the Governor’s budget will pull $3.27 billion in taxes, or 6.6%, or nearly one-fifth less than in 1992.
Ok, you say, but property taxes have taken up the slack, right? In 1992, RI cities and towns collected $990 million in property taxes, meaning that state and local taxes together were around 12.9% of the state’s economy. I don’t know what property taxes will be in 2013, but they added up to $2.11 billion in 2011. In order for them to get up to the 1992 proportion of the overall economy, property taxes will have to jump by 48% from their 2011 levels. They went up a lot last year, but no city or town’s taxes went up nearly that much.
In other words, no matter how you slice it, state and local taxes are taking up a smaller share of the state’s economy today than 20 years ago. Maybe it’s hard to believe, but it’s true: the biggest reason we’re getting less government these days is because we’re paying less for it relative to the size of the economy. If state and local taxes added up to the same proportion of our economy in 2013 as in 1992, the state and cities and towns would have an additional $900 million dollars in revenue each year, far more than the deficits of the state and all the cities and towns put together. I’m not saying that this is the right measure, but it’s not possible to argue successfully that the gross level of state and local taxes we have now is slowing the state’s economy.
Again, I know this is hard to believe, but in reality there is a specific reason why it’s hard to believe, and there are ways in which our taxes are slowing our economy. You just can’t see it in the broad averages. We’ll get to that down the road, when we get to a detailed picture of taxes. For now, I’m going to stay on spending, and focus on the makeup of the bars in the graph next.
Assistance, Grants, and Benefits (really)
The legend is a little hard to read, but the yellow at the bottom of each column is personnel expenses (which includes benefits), and moving up, you have good old “Other”, followed by aid to local governments, “Assistance, Grants and Benefits”, capital expenses, debt service, and operating transfers. Let’s look at the big ones here.
Starting again from the bottom you have personnel expenses. This includes the infamous pension payments, which have gone up a lot since 1992, but have been pretty well matched by the rise in health benefit costs. For 2013, the pension payments will be about $167 million, and health benefits $183 million [ES-32]. The 1992 payroll included a bit more than 16,000 state employees (on paper). As of now, there are 13,700 employees, almost 1,000 fewer than are officially in the budget.
What about salaries? This is a little harder. You see, until recently, the budgets were silent about how many positions were actually filled. You’d see that 16,000 employees (full-time equivalents) were approved for the budget, and that’s all it would say. But some positions hadn’t been filled for years, and lots of unfilled positions had no money appropriated for them. If you take a strict apples-to-apples comparison, you get that the average annual wage of a state employee in 1992 was about $37,000, and in 2012, it was $61,300. It turns out that this is pretty much exactly the rate of inflation for those years. On paper, at least, salaries have risen slower than the budget as a whole. It’s not possible from the public documents to say how many positions were filled in 1992 (though maybe a reader will have that number for me). But you can say that wage growth is absolutely not driving the budget’s growth.
Moving up to the purple band, you have the aid to local governments. The bulk of this is education aid, scheduled to be $674 million in 2013 [ES Appendix D]. This is a big number, and quite big enough to mask the devastating cuts to aid to the non-education parts of local government in 2008-2011. In 2008, the state appropriated $244 million for aid to municipal governments. In 2011, that number was $60 million [ES Appendix C]. Education aid was cut during those years, too, but not nearly as much. Are you still wondering why municipal governments are struggling to stay above water? You can sort of see this decrease in the 2008-2011 columns, but the presentation doesn’t make it very clear.
The blue band above the purple is the one that excites the most attention. This is “Assistance, Grants, and Benefits.” It sounds like it means welfare, but it’s just an accounting category, and covers everything from Medicaid to the money the state library gives to the Historical Society to maintain the collection of battle flags in the state house atrium, the silver tea service from the USS Rhode Island, and the other artifacts they keep for us. It also includes student aid at URI, unemployment insurance, TDI payments, and more.
The big bulk of this chunk is Medicaid, at $1.66 billion [B2-12 and B2-118 for previous years]. It is probably the fastest growing chunk of this category, too, but it’s not easy to be sure from the documents. Less than half of it is actually health care to poor people. Most of the rest is care for the disabled and elderly. The state pays approximately 48% of the cost, and federal dollars cover the other 52%.
Here’s the point I can’t help see in this graph: The biggest cost driver in the three biggest parts of the budget is health care. It’s more than 10% of personnel costs, it’s part of what cities and towns use state aid to pay for, and it’s far and away the biggest part of the Grants and Benefits layer. If you really want to find the reasons why the state is spending as much as it is and seems like it’s getting less than in 1992, the cost of health care is impossible to ignore.
And yes, you could solve the budget problem by cutting health care out of the budget—slash employee benefits, and all benefits to poor people, wheel the old people and disabled out of their group homes and down to the curb. That might keep health care costs from bankrupting the state, but it won’t keep it from bankrupting all the rest of us. If there ever was a case for government malpractice, it can be found in the utter silence of Lincoln Almond and Don Carcieri when it came to addressing this problem.
Next: Municipal Budgets
Full Series: Budgeting for Disaster