Eva Marie Mancuso, Chair,
Rhode Island Board of Education,
Rhode Island Department of Education,
225 Westminster Street,
Providence RI 02903
Eva Marie Mancuso, Chair,
Rhode Island Board of Education,
Rhode Island Department of Education,
225 Westminster Street,
Providence RI 02903
Dear Ms. Mancuso:
I read with interest in this morning’s news about the Providence School Board’s suggestion to the Board that you not rely on the NECAP test as a graduation requirement. I would like to second that suggestion, and offer some words of explanation that I believe have been largely absent from the debate until now.
The Providence board points out that the NECAP test was “not designed” to be a graduation requirement. That is quite true, but few go on to say why that makes it inappropriate to use as performance threshold for graduating students.
First, a little about me. I have worked as a freelance engineer and policy analyst for 30 years, and both occupations have required me to acquire an expertise in statistics. I speak not as a statistical layman, but as an expert hoping to translate important concepts for people who may not have deep familiarity with p-values and confidence intervals. I do not wish to condescend, but I am afraid that some basic statistical concepts have not been well understood by policy makers in the past, and consequently decisions have been made that are deeply damaging to our students, and to education in Rhode Island generally.
The important point I wish the board members to understand is what exactly is the difference between a test like NECAP, designed to rank schools and students, and a test designed to evaluate student proficiency. The short version: when you design a test like NECAP, test designers ensure that a certain number of students will flunk. What’s more, for the purposes of the test designers, that’s a good thing.
Here’s the longer version. The original goal of NECAP was to evaluate schools, and, to some extent, students within the schools. In order to make a reliable ranking among schools, you need to ensure that the differences between one school and another (or one student and another) is statistically significant. This is simply how you ensure that the rankings are the result of real differences between schools, and not the result of chance.
A traditional test, such as the final exam a teacher might give to her class at the end of the term, will likely enough have a distribution of grades that looks something like the graph below. (I use a class size of 5000 here. This is obviously a lot of students for a single class, but only a fraction of the number who take the NECAP tests.)
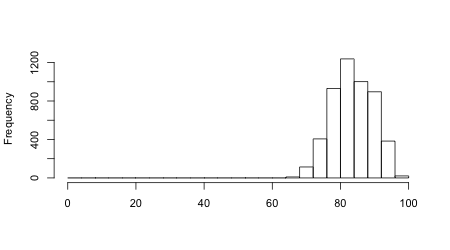
Suppose the teacher set the passing grade at 70, then about 4% of her students failed the class. That’s a shame, but it’s not unusual, and those students will have to take the class again or take the test again or whatever. If the goal is to see which of the students in the class have properly understood the material, this is a useful result.
But if the goal was to rank the students’ performance, this result won’t help much. A very large number of students scored between 80 and 84. In the graph, 1200 students, a quarter of the population, have almost the same score, and 6% of them have exactly the same score, 83. How can you rank them?
Furthermore, like any other measurement, a test score has an inherent error. For any individual student, a teacher can have little confidence that a student who scored an 80 didn’t deserve an 84 because of a bad day, a careless mistake, or, worse, someone else’s error: a misunderstood instruction, an incomplete erasure, or a grading mistake. Of course, any errors could also move the score in the other direction.
The problem is that moving a student’s score from 80 to 84 moves the student from the 18th percentile to the 38th, a huge jump. In other words, a test score might rank a student in the 18th percentile, but one can have no confidence that he or she didn’t belong in the 38th — or the 5th. Conversely, a student in the 92d percentile might really belong in the 69th or the 99th, depending on the same four-point error.
The designers of tests understand this, and so try to avoid ranking students based on the results of tests that give distributions like the above. Instead, they try to design tests so the distribution of scores looks more like the one here:
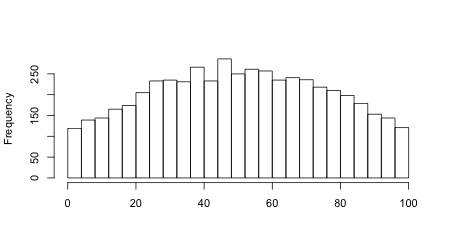
With a test that gives results like this, there are many fewer students in most of the score ranges here. Assuming the same level of error, you can be much more sure that a student who scored in some percentile belongs there, or nearby. With the same four-point error as above, you can be confident — in the statistical sense — that a student who scored in the 18th percentile on this test belongs somewhere in between the 14th and 22d percentiles, a much smaller range. A student in the 92d percentile belongs somewhere between the 89th and 95th percentile.
In other words, if a test designer wants to rank students, or schools, he or she designs the test to spread the scores out. You don’t want scores to be bunched up. This is confirmed by details provided in the technical manuals that document the test design process. For example, in section 5.1 of the NECAP 2011-2012 technical report (“Classical Difficulty and Discrimination Indices”)
“Items that are answered correctly by almost all students provide little information about differences in student abilities, but do indicate knowledge or skills that have been mastered by most students. Similarly, items that are correctly answered by very few students provide little information about differences in student abilities, but may indicate knowledge or skills that have not yet been mastered by most students.”
This section goes on to discuss how the designers evaluate test items for their capacity to discriminate among students, and demonstrates that most of the questions used in the various NECAP tests do exactly that. In other words, very few of the questions are correctly answered by all students. In Appendix F of the 2011-12 manual, you can see some item-level analyses. There, one can read that, of the 22 test questions analyzed, there are no questions on the 11th grade math test correctly answered by more than 80% of students, and only nine out of 22 were correctly answered by more than half the students.
Contrast this with the other kind of test design. In the first graph above, even the students who flunked the test would have answered around 60% of the questions correctly. The NECAP designers would deem those questions to “provide little information about differences in student abilities.” According to this theory of test design, such questions are a waste of time, except to the extent that they might be included to “ensure sufficient content coverage.” Put another way, if all the students in a grade answered all the questions properly, the NECAP designers would consider that test to be flawed and redesign it so that doesn’t happen. Much of the technical manual, especially chapters 5 and 6 (and most of the appendices), are devoted to demonstrating that the NECAP test is not flawed in this way. Again, the NECAP test is specifically designed to flunk a substantial proportion of students who take it, though this is admittedly a crude way to put it.
11th Grade Math Before leaving the subject of students flunking the NECAP tests, it’s worth taking a moment to consider the 11th grade math test specifically. Once the NECAP test was designed, the NECAP designers convened panels of educators to determine the “cut scores” to be used to delineate “proficiency.” The process is described in appendices to the technical manual:
Standard
After consulting these appendices, you will see that — at the time they were chosen — the cut scores for the 11th grade math test put 46.5% of all test takers in the “substantially below proficient” category (see page 19 of Appendix F 2007-08). This is almost four times as many students as were in that category for the 11th grade reading test and more than twice as many for any other NECAP test in the other grades.
There is no reason to think that the discussions among the panels that came up with these cut scores were not sincere, nor to think that the levels chosen not appropriate. However, it is worth noting that the tests occur almost two years before a student’s graduation, and that math education proceeds in a fundamentally different way than reading. That is, anyone who can read at all can make a stab at reading material beyond their grade level, but you can’t solve a quadratic equation halfway.
Rather than providing a measure of student competence on graduation, the test might instead be providing a measurement of the pace of math education in the final two years of high school. The NECAP test designers would doubtless be able to design questions or testing protocols to differentiate between a good student who hasn’t hit the material yet, or a poor student who shouldn’t graduate, but they were not tasked with doing that, and so did not.
Testing To be quite clear, I am not an opponent of testing, nor even an opponent of high- stakes testing. The current testing regime has produced a backlash against testing in a general way, but this is a case where bad policy has produced bad politics. It’s hard to imagine running something as complex as a school department in the absence of some kind of indicator of how well one is running it. Since educated students are the output, it is crucial to the success of the overall enterprise that we find some way to measure progress in improving that level of education.
Similarly, high-stakes graduation tests are hardly anathema. Over the past half-century, the entire nation of France has done very well with a high-stakes test at high school graduation. Closer to home, the New York State Regents’ tests are a model that many other states would do well to copy. There is nothing wrong with “teaching to the test” when the test is part of a well-designed and interesting curriculum.
However, if evaluation of progress is the goal, and if you want an accurate measurement of how well a school is doing, there is a vast body of evidence available to say that high stakes testing won’t provide that. When there are severe professional consequences for teachers and school administrators whose classes and schools perform badly on tests, you guarantee that the tests will provide only a cloudy indication of a school’s progress. Teaching to the test is only one of the possible sins. School systems across the country have seen cheating scandals, as well as such interesting strategies as manipulating school lunch menus to improve test performance. In other words, raising the stakes of a test almost certainly makes the test a worse indicator of the very things it is supposed to measure.
Furthermore, a sensible evaluation regime would be minimally intrusive, and take only a small amount of time away from instruction. After all, testing time is time during which no instruction happens. But the imposition of high stakes have rendered that nearly impossible, so instead, we have tests that disrupt several weeks of classes in most school districts, not to mention the disruption to the curriculum it has caused.
Unfortunately for the students of Rhode Island, our state has tried to take the easy way out, and use a test designed for evaluation to serve many purposes. Today, the NECAP test affects the careers of students, teachers, and administrators. It is used in a high-stakes way which guarantees that it is an inaccurate indicator of the very things it is supposed to measure. It is used for purposes far beyond its original design, producing perfectly needless pain and heartbreak across the state.
Worst of all, none of this is news to education professionals. They know how to read technical manuals and to sort through statistical exegeses of test results. They know about the harm done to students by cutting electives to focus on improving reading results. They know about the other corners cut to try to improve test results at all costs. They know that we don’t abuse the NECAP test in order to help students. They know we did this strictly to save money.
I urge you and the new education board to reconsider the state’s use — and abuse — of the NECAP test. It could be a valuable tool with which to understand how to improve education in our state. Unfortunately, poor decisions made in the past have done much to undermine that value, to our state’s detriment, and that of all the students in our schools.
Yours sincerely,
Tom Sgouros