Why it’s harder to get a better score on NECAP math retest


Deprecated: Function get_magic_quotes_gpc() is deprecated in /hermes/bosnacweb08/bosnacweb08bf/b1577/ipg.rifuturecom/RIFutureNew/wp-includes/formatting.php on line 4387

Deprecated: Function get_magic_quotes_gpc() is deprecated in /hermes/bosnacweb08/bosnacweb08bf/b1577/ipg.rifuturecom/RIFutureNew/wp-includes/formatting.php on line 4387

Now that we are in the period of NECAP retesting for seniors who failed the test as juniors, it would be good to take a look at how the math test is constructed. Because that, after all, is the test most juniors failed in the first place. In the chart below you can see how students did, item-by-item, when they took the NECAP grade 11 math test in 2012.

2012 necap math test

The thing that shoots off the page is that the curve shown in the chart doesn’t look much like a normal curve. If you remember, a normal curve is described as a “bell shaped curve”, meaning it is symmetrical, highest in the middle, and slopes downward to the right and left. To see a bell curve, look at the reading test results shown below the math test: it’s not a perfect curve, being squished a little on the left, but at least it’s some version of a normal curve.

What we see above is definitely not symmetrical, nor does is slope downward to the right and to the left—to the right, yes, there is a long, straight slope, but to the left there is a precipitous drop. Altogether, it looks like a wedge with its thin edge to the right.

What does a wedge shape mean to a student taking the test? The numbers below the bars tell you how many students got a particular item correct and you can see that very few students only got item “1” correct. But thereafter, things change dramatically and the numbers of students getting very low numbers of items correct stacks up like 95 at rush hour. In fact, in the math test, the scores the most students got were between 7 and 11 items correct—out of a possible 64! More than 300 students only got 9 items correct.

What this tells us is that the math test has no lead-up of items that gradually get more difficult. Instead, it begins with difficult items and then makes each item more difficult, which accounts for the almost straight line of descending scores to the right. This design—hard items and then harder items—makes it difficult for students to do better without putting big resources into remediation efforts of doubtful long- term value.

Defenders of the NECAP math test say the problem is not the test but the education system—bad teachers, essentially. Part of their defense rests on showing questions that students who fail the test get wrong. Adults who see these items tend to solve them and think that of course most students should get them right. But this is a bogus exercise–the adults who see these items are never in the pressurized testing environment where students encounter them, so it should not be taken seriously as a defense of the math test.

Instead, look at the reading test, shown below. It’s hard to look at the two graphs and believe the reading and math test are constructed using the same design. In the reading test, the long tail to the left indicates a run-up of easier questions and, in this situation, improving performance between tests would be a much less difficult task. The remediation might not be any more educationally meaningful, but there would be less of it, it would be less difficult to provide, and it would divert much less time, energy and money. Indeed, that is what happened.

2012 necap math 2

The NECAP math test is wrong


Deprecated: Function get_magic_quotes_gpc() is deprecated in /hermes/bosnacweb08/bosnacweb08bf/b1577/ipg.rifuturecom/RIFutureNew/wp-includes/formatting.php on line 4387

Deprecated: Function get_magic_quotes_gpc() is deprecated in /hermes/bosnacweb08/bosnacweb08bf/b1577/ipg.rifuturecom/RIFutureNew/wp-includes/formatting.php on line 4387

Recent remarks in the Journal by the Commissioner of Education point a finger away from the NECAP and toward math education in this state, “Gist said that math is the problem, not the NECAP. ‘This is not about testing,’ she said. ‘It’s about math. It’s about reading.” (Jan. 31, 2014).

A statement like this puts everyone on notice. It tells our students they had better try harder; it tells our teachers they need to stay on track and get better results; and it tells our schools they need to raise their test scores. The subtext of the statement is that there is a big crises and just about everyone in the school system is to blame.

And just behind this subtext is the further ominous and obvious subtext that everyone in the schools needs to be held accountable until we get out of this mess.

But what kind of a mess are we in? What if our low math scores are the result of how we measure math instead of how we teach math? If that is the case, there is much less of a crises and the argument for holding everyone to high stakes accountablity–students don’t graduate, teachers get fired, schools get taken over–

has much less traction.

Since a lot rides on the answer to this question—is it the way we teach math or is it the way we measure math?—it’s worthwhile trying to answer it.

One way to go about this is to compare the performance standards set by different tests. A performance standard is sometimes expressed as a grade level, as in, “the proficiency level of the grade 11 NECAP is set at a ninth grade level”. In this case, a student demonstrating proficiency would show us that he or she has mastered the expectations of a student completing ninth grade. That is, the student would get most of the questions with ninth grade content and ninth grade difficulty right, but would get many fewer questions set at higher levels of difficulty or questions covering topics not usually taught until tenth grade or later.

The way this would show up on a test would be in the average score of the students taking the test—a test set at ninth grade proficieny would have a higher average score than a test set at the eleventh grade proficiency level if they are taken by the same group of students. That makes sense–the eleventh grade standard for proficiency is harder than the ninth grade level because students have covered more content and developed stronger skills.

Back to the basic question—is it the way we teach math or the way we measure math? If we look at the way the NECAP measures reading, we can see that in the two states that take the test in grade 11, New Hampshire and Rhode Island, about 80% of students achieve proficiency. If we say 80% achieving proficiency indicates the test is at an eleventh grade level, then we have to wonder about the NAEP results students in these states achieve because less than half achieve proficiency.

We then have to ask ourselves, what performance standard is NECAP using? Whatever it is, it is much lower than the performance standard NAEP uses because a much higher percentage of students pass. In fact. over 80% more students pass NECAP than pass NAEP, so you can think of the NECAP performace standard as almost twice as easy as the NAEP performance standard. The tests are using different performance standards.

math necap chart

If you look at math, the results are startlingly different—here the percentages passing NECAP and NAEP as very comparable, meaning both tests use the same performance standard. And if you look at the NAEP reading and math performance standards, they are pretty comparable, with reading a little higher than math.

It looks like NAEP, the national measuring stick, uses about the same performance standard for reading and math while the NECAP does not.

Now, you can argue that NECAP has set the math performance standard right and has used a reading standard that is too easy. Then, of course, we would have a reading and a math problem instead of just a math problem.

But either admitting the math standard is too hard or the reading standard is too easy would mean admitting that something is wrong with the way NECAP standards have been set, something the Department of Education and the Commissioner have steadfastly denied.

I think that, at heart, they have denied such an obvious fact because it is too costly to their policy agenda to admit that anything could be wrong with the tests.

To do so would be to cast doubt on the expertise of the test designers who are the ultimate source of authority in the accountability debate. If test designers are wrong and tests are fallible, then how we measure students, teachers and schools is up for grabs. RIDE loses its top down leverage.

In the same article, Gist said, “Now is not the time to rethink our strategy.”

“Holding students accountable is really important,” she said. “We cannot reduce expectations.” The Chairman of the Board of Education, Eva Mancuso echoed the thought, “We are on the right course.” This sounds like a comment from the bridge of the Titanic.

Did the NECAP requirement make a positive difference?


Deprecated: Function get_magic_quotes_gpc() is deprecated in /hermes/bosnacweb08/bosnacweb08bf/b1577/ipg.rifuturecom/RIFutureNew/wp-includes/formatting.php on line 4387

Deprecated: Function get_magic_quotes_gpc() is deprecated in /hermes/bosnacweb08/bosnacweb08bf/b1577/ipg.rifuturecom/RIFutureNew/wp-includes/formatting.php on line 4387

What’s likely to happen to the number of students receiving diplomas in Rhode Island at the end of this year?

Even after RIDE’s release of the latest NECAP results, it’s hard to accurately predict the impact of the standardized test requirement for graduation. Historically, we know that over the past four years the percentage has averaged out to slightly less than 92%, with approximately 1,000 seniors dropping out, opting for the GED, or transferring out of state.

But last year 4,159 students failed the NECAP and needed to retake the test to try to get a passing score. Of those students, RIDE reported 1,370 succeeded. Of the remaining 2,789, RIDE reports 154 dropped out. Regardless of these drop-outs, the fall enrollment count for this fall was 10,403, which seems in line with previous fall enrollments. In other words, as RIDE stated, the impact of the testing requirement on grade 11 drop-outs was not much.

If 4,195 students failed last year and 1,370 passed this year, our best guess is that 2,789 students in this class of seniors will not graduate with diplomas. For the sake of simplicity, this number assumes that all students dropping out, moving away from the state, or getting a GED are also students who failed the NECAP on their first try.

This is what that number does to the number and percentage of seniors graduating with diplomas: it decimates them.

necap graph[* Estimates based on number of students from the class of 2014 failing NECAP for the second time (2,789)]

Of course, 2,789 is the number before students begin to take the numerous alternative tests available, including the “min-NECAP”, and activate whatever waiver process their districts have in place to compensate for a failing NECAP score.

Hopefully, the 2,789 number will go down. If districts adopt liberal waiver policies, if could go down considerably.

But from this point on, the picture for these 2,789 students looks like a form of mayhem—they will be searching out opportunities to take a variety of tests, only one of which (SAT math) has its cut-score connected to the NECAP by more than air-thin logic. Or they will be trying to get admitted into a “non-open enrollment college”. Or they will be navigating whatever waiver requirements their district has put in place, which requires them to assemble whatever evidence of academic achievement their district has decided to accept.

It’s not a pretty picture for students from here on, and that’s the larger point.

Students who come from organized, well-resourced districts and have organized, well-resourced parents will do best of all and from there on it’s downhill until the devil take the hindmost.

This is as vivid a picture as possible of why the testing policy fails the mission of our education ideal—to educate all children well and to provide an education that will be the entrée to a productive life and career. Our education system has slowly been moving in this direction by including more and more academically vulnerable students into our enrollments–students with learning disabilities, students who do not speak or write English well, students from families with little of no literacy background.

These students pose a challenge to our traditionally structured education system.

They require especially skilled teachers, special lesson plans, more time, smaller classes and, in general, more resources. But, with more adequate and equitable funding, better teacher professional development, and innovative programming, we have slowly been learning how to help these students be more successful in our schools.

The testing requirement threatens to erode this progress. The scenario most likely to emerge in the next few months–as students try to save themselves–will probably be what happened on the Titanic—most of First Class is saved and most of the others go down with the ship. The irony, and it’s bitter, is that all this is being done in the name for what’s good for kids. Anyone who speaks out against it is branded as being against high standards.

This is truly an Orwellian twist, where what is disastrous for many kids is labeled as good for all kids and where condemning some kids is the prerequisite for saving the rest. And we know who those sacrifices will be, our already vulnerable kids. Go get the low hanging fruit.

NCTQ: ‘nonpartisan’ doesn’t describe its bias


Deprecated: Function get_magic_quotes_gpc() is deprecated in /hermes/bosnacweb08/bosnacweb08bf/b1577/ipg.rifuturecom/RIFutureNew/wp-includes/formatting.php on line 4387

Deprecated: Function get_magic_quotes_gpc() is deprecated in /hermes/bosnacweb08/bosnacweb08bf/b1577/ipg.rifuturecom/RIFutureNew/wp-includes/formatting.php on line 4387

NOT NEUTRALI was one of many readers of an article by Linda Borg, “R.I. wins high marks for use of teacher evaluations” in the Providence Journal.  The article is about a report by the National Council on Teacher Quality (NCTQ) and lists the many ways—about six—that Rhode Island uses information based on teacher evaluation to improve education.

I follow teacher evaluation and as I read the article I felt a growing dissonance: an earlier article by Linda Borg (“High evaluation ratings for most R.I. teachers problematic: October 11) had reported problems with the evaluation system.  A former colleague, Chariho Superintendent Barry Ricci, said in that article “It’s not teachers being easy on themselves; it’s the [evaluation] tool that needs further refinement.”  He went on to say the evaluations place too much emphasis on test scores and student-learning objectives.  “There are many factors,” he said, “that play into test scores that are beyond the control of a school, such as absenteeism, tardiness, study habits.”

Then I recalled an even earlier article, also by Linda Borg, reporting that a large proportion—over 80%–of the teachers in Rhode Island thought the teacher evaluation process was “punitive.”

I thought it was interesting that NCTQ could do research on teacher evaluation in Rhode Island and not mention issues that had received considerable local attention, so I looked into who they are and the methods they use.  Borg characterizes NCTQ as “a nonprofit, nonpartisan research and policy group.”

But when I went on their website, another story emerged.  It says NCTQ “was founded in 2000 to provide an alternative national voice to existing teacher organizations and to build the case for a comprehensive reform agenda that would challenge the current structure and regulation of the profession.”  In other words, they are advocates for an agenda, so they can hardly be called non-partisan.

But what is that agenda?  If the report was written through the lens of their agenda, then whatever parts of the Rhode Island teacher evaluation policies agree with their agenda would be good and whatever parts didn’t agree would be in need of improvement. It’s an old game for partisan organizations—set your own standards, make judgments according those standards, then publish the results as if the standards had national standing and weight.

So it’s important to know more about the standards used for the study. Again, looking at their website, I found the report for Rhode Island and, printed on a single page, were “yes” or “no” answers to eleven questions that look a lot like standards. “Yes” was always the right answer to these questions: Rhode Island had six “yes” answers, which put it “pretty far ahead of the pack,” according to Sandi Jacobs, council vice president.

The questions all had to do with the ways in which Rhode Island uses the information from its Teacher Evaluation System. For example, does Rhode Island use teacher evaluation information to determine tenure, professional development, improvement plans, or compensation? (yes, yes, yes, and no)  Every time there was a “no”, the report made a recommendation for improvement (for example, “Develop compensation structures that recognize teachers for their effectiveness“).

No way is this report based on research–it’s based on a survey, probably filled out in the Commissioner’s office and, as such, has no chance of unearthing the kinds of issues associated with the evaluation system mentioned by Barry Ricci.

Where does the NCTQ agenda come from?  I looked up the NCTQ’s Board of Directors, as I always do to try to get a feel for an organization.  There I found Dr. Chester “Checkers” Finn, a man with an interesting resume.  He is currently the president of the nonprofit  (conservative) Thomas B. Fordham Foundation, a senior fellow at the (conservative) Hoover Institution, former Research Associate at the (very conservative) Brookings Institution–well, you get the picture, a major conservative player on the education landscape.  The part I like best about Chester’s resume is his membership in The Committee for the Free World, a defunct anti-Communist think tank.  There he rubbed shoulders with the likes of Irving Kristol, Donald Rumsfeld, and George Will.  It turns out that it’s no accident he’s on the NCTQ board—NCTQ was founded by the same Fordham Institute where Dr. Finn is president.  This feels like a form of brand laundering by Fordham.

Beyond Chester, there is a Chair who, as a democrat, supported a school voucher program in Colorado that was later ruled unconstitutional.  As she said, she was trying “to figure out as a parent what would you do if you suddenly found out that your child was 30 points behind middle-income kids and your child’s school had been failing for 20 years”.  Interestingly, the solution of trying to build up schools so that they could provide an education equivalent to “middle-income kids” never seems to have occurred to her.

The President, Kate Walsh, received substantial funding from the Bush administration to get “positive media attention” for NCLB. The product of this grant was three op-eds.  This practice was suspended because the U.S. Department of Education is not allowed to expend funds for propaganda, but it seems Kate is still publishing propaganda.

The Vice Chair, John Winn, put Florida’s A-Plus plan into action as Education Commissioner under Jeb Bush, and is currently serving as the Florida Department of Education interim commissioner under Governor Rick Scott. Enough said.

At this point, it was clear to me the agenda that drives this organization is the same pro-corporation, anti-union agenda that drives so much current education “reform”.  This agenda vilifies teachers and teacher unions and replaces teaching with scripted curriculum wherever possible.  It is backed by IT corporations, hedge fund operators, publishing companies (Pearson is big), testing companies (Pearson is big), among others.  Who else?  Well, major funding ($200,000 and above) for NCTQ comes from the Bill & Melinda Gates Foundation and the Eli and Edythe Broad Foundation, along with many other foundations I haven’t heard of.  Who else? How about Chiefs for Change, Jeb Bush’s band of ultra-reformers? And we see on the endorsing list of Chiefs for Change a familiar name, Deborah Gist, the Rhode Island Commissioner of Education.

At this point things come full circle and begin to make sense: Deborah Gist endorses the agenda of NCTQ and NCTQ uses its agenda to “evaluate” the Rhode Island teacher evaluation system that Deborah Gist is building.  Commissioner Gist gets a nice pat on the back, supplied by Linda Borg, for whatever parts of the agenda she’s implemented and, for whatever parts she hasn’t implemented, she gets told to implement them, ASAP!  It’s a “heads I win, tails you loose” set up, not a research report by a non-partisan organization.

All of this took me a day to uncover, think through, and write up.  When things are transparent, the game the NCTQ is playing seems childish—one can picture a grinning Chester Finn high fiving a jubilant Ann Walsh over this article.   But without transparency, this report seems like a legit deal. I wonder about the role of the reporter in all this.  Do we expect our reporters to take a day to uncover facts and think things through before they publish a story?  As this article shows, it would be a different world if they did.

Evaluating Eva’s op/ed


Deprecated: Function get_magic_quotes_gpc() is deprecated in /hermes/bosnacweb08/bosnacweb08bf/b1577/ipg.rifuturecom/RIFutureNew/wp-includes/formatting.php on line 4387

Deprecated: Function get_magic_quotes_gpc() is deprecated in /hermes/bosnacweb08/bosnacweb08bf/b1577/ipg.rifuturecom/RIFutureNew/wp-includes/formatting.php on line 4387

mancusoEva-Marie Mancuso’s recent (9/18/13) op-ed piece in the Providence Journal “Testing helps R.I. students achieve” offers a disingenuous rational for not discussing the current NECAP testing requirement. Her piece attempts to build a case for the Board’s exit-test policy by stringing together a series of misleading and vacuous statements that do not hold up to critical review. Here are some of the most blatant:

“We want to prepare all of our students for success, and we want to make Rhode Island’s public schools and higher-education institutions among the best in the country.”

No one engaged in the current debate about the exit-testing requirement disagrees with this goal. The disagreement is around the policies that determine how Rhode Island will use its scare resources and regulatory authority to achieve this goal. And, it should be noted that Mancuso does not have a Board united behind the current policies. On September 9 that Board voted 6-5 not to accept a petition that would have opened up the testing policy to discussion and public examination.

“The vote [by the Board not to discuss the graduation requirements] was not about the merits of any of our battery of state assessments; it was about starting the debate again about whether or not to have state assessments.”

In fact, the debate has all along been, in part, about the merits of the eleventh grade math test. This test fails a far higher proportion of students than the 11 of reading and math assessments, whether it be the National Assessment of Educational Progress (NAEP) or the Massachusetts Comprehensive Assessment System (MCAS) shows such a huge disparity between the performance standards for reading and math. So the debate has included fundamental questions about the performance standards the Board has endorsed for graduation.

“the New England Common Assessment Program (NECAP), is not the be-all, end-all — but it is one valid measure”.

I don’t know what evidence she uses to assert the NECAP is a valid measure because the NECAP technical report does not provide any credible validity study. Consequently, we do not know whether the NECAP predicts college or career readiness any better than family income, mother’s education, or number of books in the household. And, if it doesn’t, which is very likely, it is a huge waste of very scarce resources.

“[the NECAP] shows us that too many students…have not attained the knowledge and skills they will need upon graduation.”

Yet, RIDE already knows this—they know, for example that many students taking the NECAP math test have not had a geometry course and, since geometry is required on the NECAP, how could these students pass the NECAP? Making sure all schools provide the curriculum necessary to pass the NECAP is a prerequisite to implementing an exit-test requirement and one of the things Massachusetts did in their ten-year preparation phase. By rushing to implement “high standards”, the Board is already harming students unfairly.

“We don’t have to look far for support for a state assessment. Massachusetts implemented an even more stringent standard more than a decade ago, and, though assessments alone do not account for the improvements in Massachusetts, today Massachusetts ranks first among states in student achievement.”

I agree that assessments alone do not account for the improvements we see in Massachusetts. It is far more likely that they reflect a decade-long preparation, adequately financed by a state funding formula that built capacity in the poorest districts. Adequate funding means a district can conduct intense professional development, build its infrastructure, and provide supportive programming for its vulnerable students. It also means the district can maintain courses in art, music, and vocational training. Lacking a funded formula, these are things Rhode Island’s poorest districts cannot provide.

“every high school in Rhode Island offered students additional instruction and support during the school year and over the summer, in a commitment to improve mathematics achievement”.

Not true. Most high schools only passed along the state sponsored ‘math module’ which was an online test prep course with a ‘virtual’ teacher. Most students did not receive any additional instruction from the schools last year or over the summer – unless they were enrolled in those test prep courses. Already, one of the concerns of those of us who question the wisdom of this policy has become reality–districts have been forced to dedicate extremely scarce resources to providing test-prep courses that have almost no lasting impact on students’ learning.

“I have been moved and troubled by the concerns many students, educators and family members have raised regarding our diploma system.”

Perhaps, but Mancuso has remained steadfastly unresponsive to the concerns raised by parents and advocates for students with Individual Education Plans (IEPs). The NECAP failure rate of these students in math is astoundingly high—over 80% failed. Furthermore, ten years of exit testing in Massachusetts has resulted in more students with IEPs failing to get diplomas, not fewer. This long-term failure of a testing policy to close achievement gaps in Massachusetts is reflected in their being ranked as having among the worst NAEP achievement gaps. Since Rhode Island is having no success in reducing achievement gaps, the exit-exam policy seems like a bad choice.

Finally, Mancuso concludes with a plea for support, “Let’s take all of the energy that has gone into opposing statewide testing and focus it where it belongs — on improving opportunities and outcomes for our students.”

Yet the policies Mancuso asks us to support have not been defended in transparent public discussion that addresses the relevant evidence. It will do our students no good for us to blindly support a policy based primarily in ideology.

Board of Education retreat: the course is set


Deprecated: Function get_magic_quotes_gpc() is deprecated in /hermes/bosnacweb08/bosnacweb08bf/b1577/ipg.rifuturecom/RIFutureNew/wp-includes/formatting.php on line 4387

Deprecated: Function get_magic_quotes_gpc() is deprecated in /hermes/bosnacweb08/bosnacweb08bf/b1577/ipg.rifuturecom/RIFutureNew/wp-includes/formatting.php on line 4387

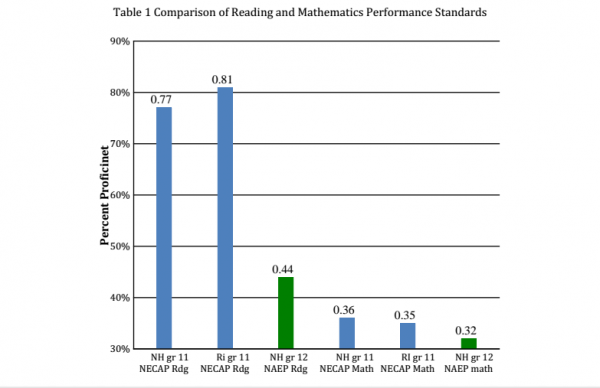
On Sunday and Monday, the Rhode Island Board of Education held its annual retreat to discuss, among many other topics, the high school graduation requirements. This was a hot topic because it includes using the NECAP as an up-or-down requirement for graduation: a student must get a 2 or more on both math and reading to graduate.

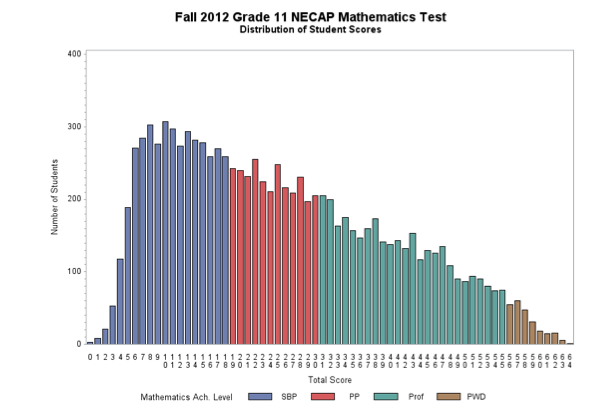
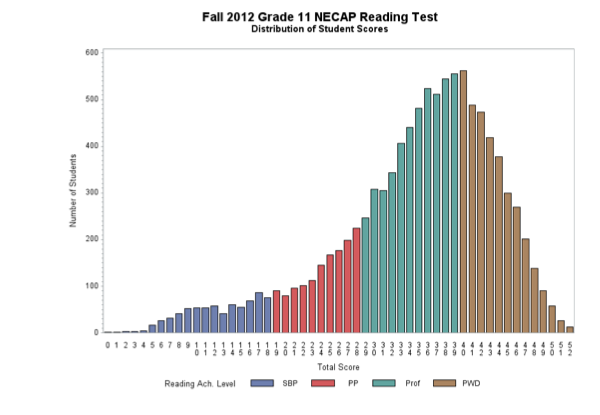
As anyone following this issue knows, there are are over 4,000 students who did not score a 2 on the last NECAP. This staggering number, representing about 40% of the students in the state, has caused considerable concern among students, their families, teachers, advocate groups, and politicians. In addition to numerous protest rallies, the city council and mayor of Providence have officially voiced doubts about this use of the NECAP and the General Assembly passed a resolution asking the Board of Education to reconsider its graduation policies.

In the midst of this mounting pressure, the Board announced plans to discuss the test related graduation requirements at its annual retreat, which it scheduled in the pleasant, and secluded, location of Alton Jones.

Initially, the Board intended to conduct this retreat in private until the ACLU and other concerned parties (including me) pointed out that this discussion amounted to conducting Board business and therefore fell under the open meetings law. The Board did not see it that way, but a judge did, and the retreat was held, open to the public, at Rhode Island College.

The retreat was keynoted by Aims McGuinness, an outside expert, who said a few interesting things to the Board. First, he emphasized the unique nature of their responsibility—creating policy that maximizes the effectiveness of the educational pipeline that moves students from earliest pre-kindergarten edu-care to successful entry into the labor market. Despite the heavy labor market emphasis, I appreciated his spelling out the big picture–and his warning that, if the Board doesn’t keep the big picture in mind, it will “get lost in the weeds.”

Aims had less to say about the elementary/secondary section of the pipeline than he did about the postsecondary section. In our colleges and university, too many students don’t make it through, degrees are not granted in economically strategic areas, and affordability for students is low. Interestingly, he DID NOT say our biggest problem was the number of unqualified high school graduates showing up on employer’s doorsteps.

Another big point Aims made is that, while many of our average numbers are good (numbers graduating, educational attainment of graduates, etc.), when you begin to disaggregate these numbers by income, race, or family education, you see “about six Rhode Islands”, areas defined by large inequalities in wealth and opportunity. These inequalities, Aims stated, will drag the state backwards as it tries to build an education pipeline that feeds an improving economy. During his presentation, he came back to this point repeatedly: inequality is a ball and chain that will drag this state down.

The final point from Aims was the need for a system—educational and economic–that promotes innovation. This makes sense to me—innovations become established ways of doing things and lose their effectiveness, so we need a system that continually promotes innovation. This is a pretty thoroughgoing project—you can’t develop innovative students in a system with conventional teaching, and you can’t promote innovative teaching with conventional administrations operating under conventional policies.

My big takeaway? The Board of Education needs to develop policies that create an educational pipeline that promotes equality and innovation. I was pretty happy with the way Aims set the stage.

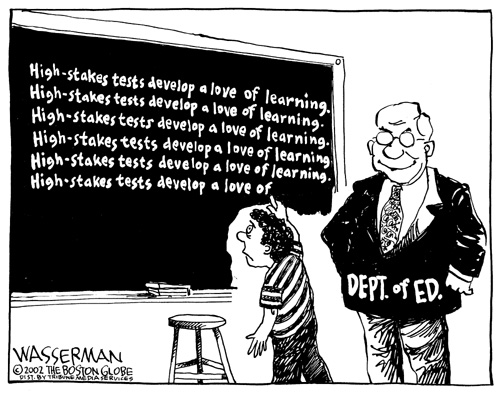
But then reality struck—the Department of Education began to go to work to convince the Board that the NECAP graduation requirement was crucial to the success of education reform in Rhode Island.

A big part of their argument was that it worked in Massachusetts, so it will work here. In order to make this argument, they brought in Don Driscoll, the former Commissioner of Education in Massachusetts who implemented the 1993 Education Reform Act. That legislation resulted from the state losing a lawsuit that required them to put in an adequate and equitable public education funding system. You might recall Rhode Island lost a similar lawsuit (under Judge Needham) but then it won it (under Judge Lederberg). So Rhode Island was never required to adequately or equitably fund its education system.

But Massachusetts was. The new law required that, after a seven-year phase-in, every local school district spend at least a state-mandated, minimum amount per pupil, for which the law provided much of the funding. This minimum “foundation budget,” is supposed to cover the costs of adequately educating different categories of students (regular, limited English proficient, special education, low income, etc.), and consequently varies by district.

In addition to creating a testing requirement for graduation, Massachusetts provided a seven-year ramp-up in state funding to beef-up poor districts and their schools. I emphasize all this because Driscoll barely mentioned it and I think it probably has a lot to do with whether Rhode Island will meet with the same success Driscoll proudly described achieving in his state.

So, a seven-year ramp-up of state funding and a ten-year period of professional development preceded the implementation of the test requirement, but Driscoll treated these as unimportant, saying nothing much happened until the test requirement kicked in and people started to focus.

In my arrogance, I’d like to contradict Driscoll on the point that nothing was happening in Massachusetts before the testing requirement kicked in; NAEP testing shows that educational attainment in Massachusetts was on the rise even before the state kicked in significant new money. Some myths—such as the test is the only thing that matters–just don’t stand up to the evidence.

The other point that got swept under the rug by Driscoll was how stubborn gaps in educational inequality are. The following excerpts are from Twenty Years After Education Reform: Choosing a Path Forward to Equity and Excellence for All (French, Guisbond and Jehlen, with Shapiro, June 2013):

  • •Massachusetts’ progress in narrowing gaps has been outpaced by most other states in the nation, leaving Massachusetts with some of the widest White/Hispanic gaps in the nation. Massachusetts now ranks near the bottom of all states in terms of our White/Hispanic gap, ranging from 38 achievement gaps in math and reading at the 4
  • In terms of the White/Black achievement gap…The ranking of 23 gap in 4 Massachusetts with a ranking of 35 between Black and White students at both the 4th and and 8th grades.
  • The state’s Hispanic graduation rate ranks 39th out of and is lower than the national average. This places Massachusetts 31st of 49 states for the gap between black and white student graduation rates (with 1st meaning the gap is the smallest of 47 states for the size of the gap between Hispanic and White student graduation rates.
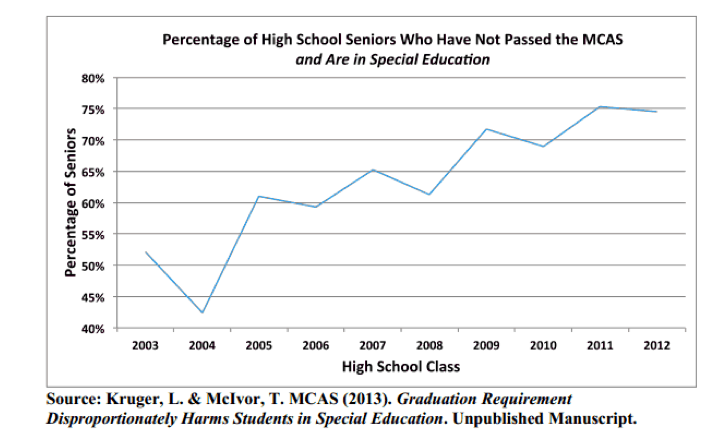
  • The NAEP test score gap between free/reduced lunch and full-paying students in Massachusetts remained static across both grades and disciplines, while other states have made progress in reducing this gap. As a result of this pattern, Massachusetts’ ranking  has fallen over years so that the state is now ranked from 27 score gap by income.
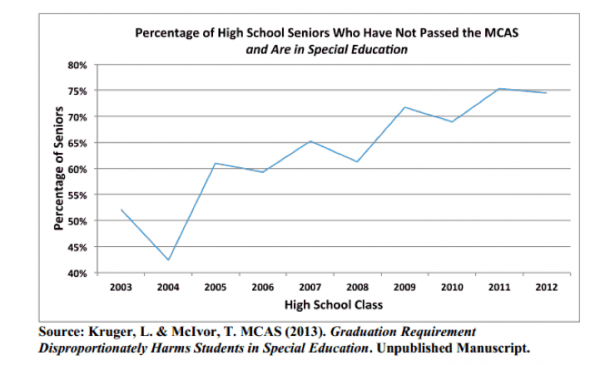
  • And, for students in Special Education, this graph speaks for itself:

mcas graph


What is interesting about these facts—besides that they were never mentioned—is that they should give pause to a state Board just charged with promoting equity as a top priority. In fact, a Board truly concerned with equity would see these indicators as huge red flags standing in the way of adopting the NECAP as a graduation requirement.

Finally, I am compelled to mention another difference between Rhode Island and Massachusetts that is relevant to expecting the same level of success in Rhode Island as Massachusetts experienced.

Massachusetts has a population that is significantly wealthier and more educated that Rhode Island. While I do not subscribe to the idea that wealth and education pre-determine educational attainment, it would be blindly foolish not to recognize that these factors tilt the playing field: wealth tends to provide opportunities and education tends to replicate the values and skills that produce educational attainment.

Depending on the indicators of wealth and education you choose, a plausible argument can be made that Massachusetts is, on average, the wealthiest and best educated state in the country: no such argument can be made in Rhode Island. But in RIDE, where teachers are the only factor that matter for educational quality, wealth and education are not considered when making policy.

For me, the highlight of the day was a skyped in interview with Tony Wagner, a Harvard professor with lots of experience educating urban students. Tony said a lot of important things, but the heart of what he said was that if we want to be successful with urban students and close the achievement gaps that are dragging us down, we need to figure out the problem of motivating students.

His answer, in simplified form, is to build on what students know and are interested in, using this as the beginning point for teaching. In Tony’s approach, students would work with teachers, who would function as much as mentors as advisors, to educate themselves in the areas they are interested in. Tony advocated that students undergo continual evaluation of their work and that this evaluation cumulate in an electronic portfolio.

While this abbreviated description does no justice to the power of Tony’s approach, it almost didn’t matter because the Board showed little interest in the only presentation that addressed the issue of inequality, closing performance gaps, and education that promotes innovation.

Instead, it showed an intense interest in the speakers who affirmed the valued of using the NECAP as a graduation requirement. These speakers included the President of Measured Progress, a contractor that works for RIDE. You can be sure these guys will tell you what you want to hear.

On Monday, one member of the Board, a swing vote, was reported in the Journal as saying the presentation had convinced her that using the NECAP was the way to go. Luckily, I was there to witness how policy gets made. Otherwise, no one would know they are deep in the weeds.

How NY, RI differ on high-stakes tests, grad requirements


Deprecated: Function get_magic_quotes_gpc() is deprecated in /hermes/bosnacweb08/bosnacweb08bf/b1577/ipg.rifuturecom/RIFutureNew/wp-includes/formatting.php on line 4387

Deprecated: Function get_magic_quotes_gpc() is deprecated in /hermes/bosnacweb08/bosnacweb08bf/b1577/ipg.rifuturecom/RIFutureNew/wp-includes/formatting.php on line 4387

seattle-test-boycottAs the recent legislative session wound down on Smith Hill, the General Assembly passed resolution H5277, which asked the Board of Education not to use the high-stakes, standardized NECAP test as a graduation requirement.

It said, in part:

“…this General Assembly hereby urges the Board of Education to reconsider the current graduation requirements including the use of the state assessment and examine using a weighted compilation of the state assessment, coursework performance, and senior project or portfolio; and be it further

RESOLVED, That this General Assembly respectfully requests that the Board of Education delay the state assessment portion of the graduation requirement to allow for adequate time for students to be immersed in the common core curriculum;”

Now the ball is in the Board’s court.  Newly constituted and charged with a broader set of responsibilities than either of it predecessor boards, how they react to this resolution will be an indicator of how seriously they take their responsibility to re-examine a policy not of their making.  Will they, elect for a “quick fix”, or will they take the opportunity to consider what is best for meeting the needs of the Rhode Island public education system?

Anticipating this question, I wrote to a noted critic of standardized testing, Diane Ravitch.  In my email, I said I was interested in measuring learning “using instruments that look like the kinds of challenging performances schools and businesses require.”

Ravitch replied:

“The best example I know is the NY Performance Standards Consortium
20 years old
Great results”

So I looked up the New York Performance Standards Consortium and was amazed by what I found—it was as if I had entered a different world from the one that is being put in place here.  Before I describe that world—at least partially—let me back up and review the reasons why finding an alternative world is so important, just sticking with issues related to testing students.

Many arguments have been advanced against using the NECAP as a graduation requirement.  To my mind, the most significant are:

  1. Its negative impact on the most vulnerable students in the system, the students with learning and behavior disabilities, the students just learning English, and the students from disadvantaged economic backgrounds.  All these students fail the NECAP in much higher proportions than “normal” students.  Each of these kinds of students face different challenges in their struggles to achieve proficiency, but none of these categories of students receive the educational and programmatic support required for success.  For these students, in the absence of improved support, the NECAP shuts the door to graduation.
  2. Its negative impact on curriculum, where the NECAP exerts a powerful influence on perceptions of whether a course is valuable or not.  Recently, courses that are not viewed as contributing directly to better test scores, such as the arts and other electives, have disappeared from the curriculum.  This is not entirely the fault of the test, since the recession, budget cuts have played a large role in shrinking educational provision to students.  Nonetheless, the way courses are selected for elimination I highly influenced by the test.
  3. Its negative impact on the depth of instruction.  One of the targets of educational reform has been the style of teaching in which teachers lecture and the student memorize material.  Students then demonstrate their mastery on quizzes and tests that cover the factual content of the lecture.  However, the NECAP, because it asks questions that are either right or wrong, reinforces this style of learning.  Teachers react to the NECAP by teaching content rather than thinking about content.

All three of these problems are related—the NECAP tends to create classroom environments that are narrowly focused and these are environments where students with less support fail.

The challenge then is to find an assessment system that keeps curriculum broad, pushes learning and teaching to be challenging and thoughtful, and supports weaker learners.  The response to this challenge, as exemplified by the New York Performance Standards Consortium (NYPSC), is to develop tests that assess performance according to the New York standards.  A performance assessment is distinguished from a standardized test by requiring a student to think about, and do something with, academic content beyond memorizing it.

As soon as you begin to test thinking, the idea of scoring a performance as right or wrong becomes nonsensical because thinking is seldom completely correct or completely wrong.  Instead, the meaningful performance standards that can be applied to thinking include qualities such as completeness (did the student include the relevant facts, information, evidence, etc.), coherence (did the student assemble the evidence into an internally consistent argument), persuasiveness (did the student address other perspectives in this/her argument), and other similar criteria.  As the consortium literature explains:

“The tasks require students to demonstrate accomplishment in analytic thinking, reading comprehension, research writing skills, the application of mathematical computation and problem-solving skills, computer technology, the utilization of the scientific method in undertaking science research, appreciation of and performance skills in the arts, service learning and school to career skills.”

If these are the criteria that students need to meet, then it is easy to see why performance assessments avoid the trap described in item 3 above, lowering the depth of instruction.  By making explicit, and describing, the kinds of thinking students need to be able to do within content, these assessments serve as constant reminders of the appropriate depth at which learning and teaching should be conducted.

Because performance assessments are embedded in courses and do not test abstract “reading” and “math”, they do not tend to narrow the curriculum.   Instead of eliminating courses because they do not teach math or reading, states, schools districts and schools can make decisions about what students need to know in order to graduate.  They could, for example, decide that every student needs to demonstrate proficiency in a set of core courses, but then allow the student freedom to demonstrate proficiency in an elective area of interest.  All of a sudden, the system becomes much less “one size fits all”.  It does not take a lot of imagination to think up ways that graduation requirements based on performance can be elaborated in ways that intrigue, incent, and reward students in a wide variety of ways.

In order to be more concrete, let’s take a look at what performance assessments in English/Language Arts and math look like in the NYPSC:

Literary Essays That Demonstrate Analytic Thinking:

  • Why Do They Have to Die: A Comparative Analysis of the Protagonists’ Deaths in “Dr. Jekyll and Mr. Hyde,” “Metamorphosis” and “Of Mice and Men”
  • What Role Do Black Characters Play in Faulkner’s “The Sound and the Fury” and Flannery O’Connor’s Short Stories?
  • How Do Puzo’s Characters Change from Book to Film in the Godfather Saga?
  • Insanity in Literature: “Catch-22,” “One Flew Over the Cuckoo’s Nest” and Selected Short Stories

Problem-Solving in Mathematics That Demonstrates High Level Conceptual Knowledge

  • Regression Analysis for Determining Effect of Water Quality on Cosmos Suphureus
  • Finding the Parabolic Path of a Comet as It Moves Through the Solar System
  • Developing a Computer Program to Create the Brain Game
  • Determining and Proving Distance Between Two Points Using Trigonometric Formulas
  • Isaac Newton’s Laws: Discoveries and the Physics and Math Behind a Model Roller Coaster.

As I look at this list, it becomes a lot harder to think of performance assessments as fluff—they are the real deal and a serious challenge to the NECAP.  They have been in use for twenty years in the consortium (it was formed in 1997).  In the consortium, school and district professional development is focused on promoting the ability of teachers to get students to think well—that is, to pass the assessments.  Somehow, I don’t have a negative reaction to this version of teaching to the test.

The integrity of the assessments is maintained by an outside Performance Assessment Review Board, which does what most school districts do in the other English speaking countries—England, Canada, Australia and New Zealand, where the testing system is much closer to this form of performance assessments than it is to NECAP.  Those countries, by the way, tend to perform better than we do on international measures of reading and math.  You can argue why that is the case for any number of reasons, but it’s hard to argue their performance assessment system is holding them back.

But what about the first objection to the NECAP that I listed—that the NECAP, as a graduation requirement, has a negative impact on the most vulnerable students in the system?

I’ve already argued that performance systems hold out the possibility of vitalizing teaching and learning for everyone, which would help these students.  I also believe that assessing knowledge in context, not as isolated facts, is also a more natural way to think, so that would also help.  But I see the issue of the 4,000 students who would loose their diplomas in the name of “high standards” as an issue of responsibility related to the use of the NECAP rather than an educational issue related to the nature of the NECAP.

It is very easy to use a test—any test—to draw an arbitrary line in the sand that separates one group of students from another.  But who takes responsibility for the students on the wrong side of that line?  Who changes the classrooms, develops the teachers, revises the curriculum, and puts in the support programs these students need to get over the line?  And if the line consigns many more children to failure than we can get over the line, then it is irresponsibly destructive to draw the line.

Letter from Measured Progress: All is Well!


Deprecated: Function get_magic_quotes_gpc() is deprecated in /hermes/bosnacweb08/bosnacweb08bf/b1577/ipg.rifuturecom/RIFutureNew/wp-includes/formatting.php on line 4387

Deprecated: Function get_magic_quotes_gpc() is deprecated in /hermes/bosnacweb08/bosnacweb08bf/b1577/ipg.rifuturecom/RIFutureNew/wp-includes/formatting.php on line 4387

measured progressOn June 3, 201, Commissioner Gist received a letter from the Principal Founder of Measured Progress concerning the NECAP. It said, in part:

“While graduation decisions were not a consideration when the NECAP program was designed, the NECAP instruments are general achievement measures that are reliable at the student level”

First of all, it is interesting to speculate why such a letter would be sent at this particular time, well after setting the policy requiring the use of NECAP for graduation decisions. I speculate that the letter was requested to reassure a restive Board of Regents, but that is just my guess.

Still, if this is intended as reassurance from Measured Progress, it can only be read as tepid. First, the letter acknowledges that the NECAP was never designed to measure the learning of individual students. It was, instead, designed as a general achievement measure. Unspoken is the reality that, if the NECAP had been designed to measure the learning of individual students, it would have been designed much differently. But, that question, which drags in issues of test validity, was not asked and was not addressed.

There is not a word about test validity in the letter. That is, there is no claim that the test provides information that predicts “college and career” readiness any better than a large number of other contending measures: grades, recommendations, work or leadership experience, portfolios, senior projects, or socio-economic background.

Actually, test scores track socio-economic background so closely that it would be difficult to do a good job of distinguishing the two in a validity study.

So, there is no claim in the letter that the test is more useful than information that is already available. But there is the important claim that the test is reliable at the student level. And, after all, it is the reliability of the NECAP score that contributes so much to its attraction– that attraction being the simplicity of reducing a complex history of learning into two numbers–one for reading and one for math. After all, what could be more objective that a single number? Like the current balance of a bank account, this number tells us how much reading and math the student knows.

But the test score number is not like the current balance of a bank account, which is an exact number. Instead, it is an estimate of how much a student knows. Part of the test score is what the student really knows—the true score–and part of the test score is the mistakes the student makes—getting something wrong he/she really knows, or getting something right that he/she really does not know. These mistakes create error in the test score–the more error in the test score, the less reliable it is.

When testing companies like Measured Progress talk about reliability, they talk about the reliability of the test. They mean that, using different analytical techniques, they can tell how much measurement error the test contributes to the score of a student.

Using a camera as an analogy, this is like telling someone how much the lens distorts a picture. In photography, where the subject doesn’t contribute distortion to the picture, this is all you need to know. If, to pick a number, the test is reliable at the .85 level for students, that means that .15, or 15% of the test score is error.

The usual way to deal with the error is to turn it into an error band around the reliable portion of the score. Thus, when RIDE creates a cut-score for graduation, it puts an error band around it and takes the score at the bottom of the error band as the cut-score. Voila, fair and true cut scores!

But in testing, the person tested has long been acknowledged as a source of distortion, or variation, or measurement error (see Thorndike, 1951). Beyond the test itself, the person tested contributes random variation based on “health, motivation, mental efficiency, concentration, forgetfulness, carelessness, subjectivity or impulsiveness in response and luck in random guessing”.

If you ask teachers, parents, or anyone else who actually knows students, one of the first things they bring up is how differently students behave from day to day. They worry about whether a student will have a good day or a bad day when they take the NECAP. They assert as commonplace knowledge that the same student can get very different scores on the same test on different days. This kind of variation is called test-retest error.

Yet there is no reporting on this source of measurement error in the NECAP Technical Report. Partly, this is because getting test-retest reliability entails serious logistical problems—large numbers of students need to take parallel forms of a test in a relatively short period of time. It’s difficult and prohibitively expensive.

But recent improvements in techniques for analyzing tests (Boyd, Lankford & Loeb, 2012) have changed this and, all of a sudden, we can begin to understand the reliability of students when they take “general achievement measures”, i. e., standardized achievement tests.

To return to our camera analogy, in addition to understanding how much distortion the lens produces, we can now begin to understand how much distortion the object of observation causes. Now, instead of one layer of error, we have two layers of error and they impact each other as multipliers. If, for example, the lens is .85, or 85%, reliable, and the subject is also .85, or 85%, reliable, the total reliability is .85 X .85, or .72.

Reliability of .72 means that more than a quarter of the score (28%) is error. In other words, taking the student into account, the test is a lot less reliable than we thought it was when we only took the test into account. As the authors cited above report:

“we estimate the overall extent of test measurement error is at least twice as large as that reported by the test vendor…”

The test referred to by the authors– developed by CTB-McGraw Hill–is very similar to the NECAP.

All of this casts stronger doubt on the wisdom making the NECAP a graduation requirement. Not only is the NECAP flawed in the several ways discussed in this column before—it discourages students, victimizes the weaker students in the system, constricts curriculum, and degrades teaching and learning–but one of its chief virtues, its reliability, is seriously oversold.

Underestimating test reliability is bad for a student graduation requirement, but we should also consider the impact on the whole accountability structure: teacher assessments are based not on just one student test, but several, so increases in unreliability puts the evaluation system in doubt. Likewise, accountability associated with schools—the measures defining Priority Schools and, school progress and gap closing, to name a few. The whole house of cards is now exposed to a stiff breeze.

Teaching to test ‘dumbs down’ public education


Deprecated: Function get_magic_quotes_gpc() is deprecated in /hermes/bosnacweb08/bosnacweb08bf/b1577/ipg.rifuturecom/RIFutureNew/wp-includes/formatting.php on line 4387

Deprecated: Function get_magic_quotes_gpc() is deprecated in /hermes/bosnacweb08/bosnacweb08bf/b1577/ipg.rifuturecom/RIFutureNew/wp-includes/formatting.php on line 4387

high-stakes-testing-from-www-rethinkingschools-orgTom Sgouros has raised compelling reasons against using the NECAP as a graduation requirement, including the distorting effect of the NECAP on curriculum. The most obvious impact—accelerated by school budgets under intense fiscal pressure—is the elimination of subjects not on the test: music, arts, and career tech are among the endangered species.

There is another important point that hasn’t received as much attention, the “dumbing down” effect of the NECAP. Here, people talk about how the curriculum is turning into “test prep” and that test prep is boring and meaningless.

Is test prep—instruction keyed to the NECAP–really boring and meaningless? One way to answer this question is to look into the NECAP technical report, which specifies both the content and the level of intellectual difficulty on the test. (pages 6 & & of the current NECAP technical report). There, intellectual difficulty is described in terms of levels of “Depth of Knowledge”, a scheme developed by Norman Webb. The technical report supplies the following descriptors of Levels 1 and 2 for reading:

  • Level 1: This level requires students to receive or recite facts or to use simple skills or abilities…Items require only a shallow understanding of text presented…
  • Level 2: This level includes the engagement of some mental processing beyond recalling or reproducing a response…Some important concepts are covered but not in a complex way

Neither of these levels require what is commonly described as “thinking”, that is, understanding what is in a text and then doing something with it—analyzing it, connecting it to another text, placing it in context, or any number of valuable intellectual activities. Instead, items at these levels require students to parrot back what is in a passage. And ultimately parroting is boring and meaningless.

How much of the grade 11 NECAP tests for the ability to parrot? On page 7, the report tells us that 23% of the grade 11 reading items are at level 1 and 69% are at level 2–over 90% of the test is at a very low level of cognitive complexity. The situation in math is similar. When teachers use released NEAP items as their cue for what to teach, it is no wonder that the entire intellectual level of teaching and learning is dumbed down. So the rumors are true and there is real evidence explaining why the NECP is a force dumbing down teaching and learning.

But the fact that the NECAP is at a low level of intellectual sophistication seems to clash with the fact that many students “fail “ the test—nearly 40% of the state in math. But if you think of parroting as singing back the song you heard, it’s obvious some songs are easier to sing back than others, so in reading just make the grammar more complicated, the vocabulary more unfamiliar and the song gets harder to parrot. Furthermore, test makers can boost difficulty by giving a choice of several very similar songs as right answers. In other words, a relatively simple intellectual task can be made artificially more difficult by the wiles of test construction. Let me know if you detect anything morally suspect in this.

The second reason Tom gives (March 23 RIFuture.org) for not using the NECAP has to do with the purpose it serves. Tom points out that the NECAP was designed to measure as wide a spectrum of achievement as possible in schools. There is a lot of diversity in achievement in a school, so the test needs to include items that are very hard and very easy–and everything in between—to measure that diversity. This is very different from a test designed to see whether a student has mastered a body of knowledge—such as that taught in a course—or not. For this kind of decision, a test requires items that measure the required body of knowledge at the required level of difficulty. Instead of a full spectrum of item difficulty, items would be tightly clustered at the passing level.

Which of these two tests seems most appropriate to making a determination of whether a student has mastered the minimum amount required to graduate? Clearly the second kind—if your primary interest is in whether a student has achieved the required minimum competencies for graduation, you would cluster your items closely around this cut-point so you could make that determination as accurately as possible.

We know (see http://www.transparency.ri.gov/contracts/bids/3296220_7058821.pdf) that RIDE intends to extend—at a cost of over one million dollars–its testing contract with Measured Progress to write a test that will be used in 2015 to determine whether seniors will graduate. We should ask whether this was a smart use of money.

The answer is basically “No”. The contract extension calls for Measured Progress to produce another edition of the NECAP. As a general standardized test, the NECAP spreads its items across all four performance levels, including proficient (level 3) and proficient with distinction (level 4).

But this test will only be used to make only one judgment: whether a student is at level 1 substantially below proficient, or not. The only items that need to be on this test are those that measure whether a performance is at level 1 or at level 2—this, after all, is what determines whether a student graduates.

From the NECAP blueprint we know that only 28 of the 52 total items on the reading test and 30 of 64 items on the math test measure level 1 and 2 performance. In other words, a test half the length of the NECAP could do the job just as well.

In fact, a different test could do a better job by adding a few more level 1 and level 2 items in each of the content areas measured by the test to increase the reliability of the cut score. However, it seems that this kind of strategic thinking is not being done at RIDE, the contract was just routinely rolled over—at great cost–once again.