Time for RIDE to define mayoral academy enrollment


Deprecated: Function get_magic_quotes_gpc() is deprecated in /hermes/bosnacweb08/bosnacweb08bf/b1577/ipg.rifuturecom/RIFutureNew/wp-includes/formatting.php on line 4387

Deprecated: Function get_magic_quotes_gpc() is deprecated in /hermes/bosnacweb08/bosnacweb08bf/b1577/ipg.rifuturecom/RIFutureNew/wp-includes/formatting.php on line 4387

rimaOn June 10 and 12, RIDE hosted public hearings at the Woonsocket Senior Center on an application to create the RISE Mayoral Academy, serving students in Woonsocket, North Smithfield and Burrillville.  RISE is potentially the fifth of this only-in-Rhode Island type of multi-district charter school, after the two Blackstone Valley Prep (BVP) schools, the Achievement First Providence Mayoral Academy (AFPMA), and Hope Academy, opening this fall serving kindergarten and first graders from Providence and North Providence.

RISE’s application proposes that “fifty percent of available seats will be offered to students living in Woonsocket, with the remaining 50% available split between Burrillville and North Smithfield.”  Whether this policy is legal is an open question.

One of the central definitional features of a mayoral academy is, to quote the original statue (RIGL 16-77.4-1):

A “mayoral academy” means a charter school … which enrolls students from more than one city or town including both urban and non-urban communities and which offers an equal number of enrollments to students on a lottery basis…

This suggests that each community, or the communities grouped by type, must be offered the same number of student seats in the school, selected by drawing from separate lottery pools if necessary.  That is how Blackstone Valley Prep (née Democracy Prep) interpreted and implemented the law from the beginning, with 1/4 of the seats first offered to students from each of the four communities.

This means that, for example, if there were 80 available seats, and 20 applicants from Lincoln, all 20 would be accepted.  If there were 200 applicants from Pawtucket, they would go into a lottery for that city’s 20 available seats (plus any seats left unclaimed by other communities).

However, in 2012, Rhode Island Mayoral Academies (RIMA) asked RIDE for clarification of this clause.  RIDE’s legal department’s opinion was that this clause is superseded by a phrase in the following subsection:

If the total number of students who are eligible to attend and apply to a mayoral academy is greater than the number of spaces available, the mayoral academy shall conduct a lottery to determine which students shall be admitted.

Because this refers to “lottery” singular, as does RIDE regulation elsewhere, RIDE’s lawyers believed that there could not be multiple per community “lotteries.”

This was used as the legal justification for allowing AFPMA to use a single lottery pool for all four participating communities (Providence, North Providence, Cranston and Warwick), and for Hope Academy to do the same for Providence and North Providence students.  Thus AFPMA became a segregated low-income and minority school, despite nominally including the participation of three “non-urban” communities.

Nonetheless, RIDE has also continued to accept applications including enrollment procedures that its legal department believed to be illegal as of 2012 , including the 50/50 split RISE Academy proposes.

In February of 2014, RIDE issued new document: Rhode Island Charter Public Schools: Lottery & Enrollment Guidance, with a truly impressive example of bureaucratic question-ducking.  The guidance on mayoral academy enrollment, in its entirety, reads:

State statute requires Mayoral Academies to enroll from “more than one city or town including both urban and non-urban communities and which offers an equal number of enrollments to students on a lottery basis; […]” In order to fulfill statutory obligations, Mayoral Academies must submit for approval to RIDE enrollment procedures describing how the school intends to offer an equal number of enrollments on a lottery basis to students from both urban and non-urban communities.

That is, RIDE’s “guidance” does not explain its interpretation of the law, whether that is still represented by the 2012 opinion, or some subsequent internal revision.

The bottom line is that either BVP and the proposed RISE Academy are running an illegal enrollment lottery, or AFPMA and the Hope Academy are, with RIDE and the Board of Education’s approval.  The four schools are working under at least two incompatible interpretations of the charter school statute.  They cannot all be correct.

Before the Board of Education approves another mayoral academy, they must first make RIDE do its job and publish clear, complete, public guidance on the legal requirements for mayoral academy enrollment and ensure consistent application across existing mayoral academies

The NECAP standards aren’t that different than the Common Core standards


Deprecated: Function get_magic_quotes_gpc() is deprecated in /hermes/bosnacweb08/bosnacweb08bf/b1577/ipg.rifuturecom/RIFutureNew/wp-includes/formatting.php on line 4387

Deprecated: Function get_magic_quotes_gpc() is deprecated in /hermes/bosnacweb08/bosnacweb08bf/b1577/ipg.rifuturecom/RIFutureNew/wp-includes/formatting.php on line 4387

NECAP Logo Color Sm 100Elisabeth Harrison’s generally good story on the Common Core in Rhode Island contains this passage:

Marilyn Adams, an expert on early reading and a professor of cognitive and linguistic sciences at Brown University helped write the standards for early reading. She says the result is far from perfect, but she does believe it is better than almost any other set of state standards out there.

“And by the time you get to the upper grades, they’re stronger than anything out there, they really are,” Adams said. “In terms of literature, in terms of writing, in terms of thoughtfulness that’s expected to permeate the curriculum, they are intellectually stronger.”

When an expert’s comment is that a document is “far from perfect,” and then goes on to praise some of the parts furthest removed from her expertise, it is a bit of a tell.  While standards documents are extensive and tedious, individual sections are manageable, so let’s just look at the 11th and 12th grade reading literature standards in the Common Core and the current NECAP.  I’ve just shortened them up a bit by removing the number codes and parenthetical examples.

Common Core

  • Cite strong and thorough textual evidence to support analysis of what the text says explicitly as well as inferences drawn from the text, including determining where the text leaves matters uncertain.
  • Determine two or more themes or central ideas of a text and analyze their development over the course of the text, including how they interact and build on one another to produce a complex account; provide an objective summary of the text.
  • Analyze the impact of the author’s choices regarding how to develop and relate elements of a story or drama.
  • Determine the meaning of words and phrases as they are used in the text, including figurative and connotative meanings; analyze the impact of specific word choices on meaning and tone, including words with multiple meanings or language that is particularly fresh, engaging, or beautiful.
  • Analyze how an author’s choices concerning how to structure specific parts of a text contribute to its overall structure and meaning as well as its aesthetic impact.
  • Analyze a case in which grasping a point of view requires distinguishing what is directly stated in a text from what is really meant.
  • Demonstrate knowledge of eighteenth-, nineteenth- and early-twentieth-century foundational works of American literature, including how two or more texts from the same period treat similar themes or topics.
  • By the end of grade 12, read and comprehend literature, including stories, dramas, and poems, at the high end of the grades 11-CCR text complexity band independently and proficiently.

NECAP

Demonstrate initial understanding of elements of literary texts by…

  • Identifying, describing, or making logical predictions about character, setting, problem/solution, or plots/subplots, as appropriate to text; or identifying any significant changes in character, relationships, or setting over time; or identifying rising action, climax, or falling action
  • Paraphrasing or summarizing key ideas/plot, with major events sequenced, as appropriate to text
  • Generating questions before, during, and after reading to enhance/expand understanding and/or gain new information
  • Identifying the characteristics of a variety of types/genres of literary text
  • Identify literary devices as appropriate to genre

Analyze and interpret literary elements within or across texts, citing evidence where appropriate by…

  • Explaining and supporting logical predictions or logical outcomes
  • Examining characterization motivation, or interactions, citing thoughts, words, or actions that reveal character traits, motivations, or changes over time
  • Making inferences about cause/effect, internal or external conflicts, or the relationship among elements within text(s)
  • Explaining how the narrator’s point of view, or author’s style, or tone is evident and affects the reader’s interpretation or is supported throughout the text(s)
  • Demonstrating knowledge of author’s style or use of literary elements and devices to analyze literary works
  • Examining author’s style or use of literary devices to convey theme

Is one of these clearly intellectually stronger than the other?  Why should we think they would be, since the NECAP standards were published in 2006 and closely aligned to Achieve’s American Diploma Project standards, which were a direct precursor to the Common Core standards?  There was no breakthrough in our understanding of high school or collegiate English in the intervening three years.

In terms of writing, it depends on if you believe that being “intellectually stronger” requires an almost singular focus on one particular type of formal, logical, academic argument.  If you believe that writing for self-expression or aesthetic reasons makes you intellectually weak, you may agree with Dr. Adams and Common Core proponents.  On the whole, though, at the high school level Rhode Island’s old and new writing standards are more similar than different.

People don’t trust the Common Core because most of what what we have been told about the standards is obviously not true.  Some people are a bit confused about exactly which bits are the lies, but it is no wonder given the context.

Four years later: Student achivement and Central Falls’ transformation


Deprecated: Function get_magic_quotes_gpc() is deprecated in /hermes/bosnacweb08/bosnacweb08bf/b1577/ipg.rifuturecom/RIFutureNew/wp-includes/formatting.php on line 4387

Deprecated: Function get_magic_quotes_gpc() is deprecated in /hermes/bosnacweb08/bosnacweb08bf/b1577/ipg.rifuturecom/RIFutureNew/wp-includes/formatting.php on line 4387

cfhsAs we approach the four year anniversary of the tumultuous firing of the the teachers at Central Falls High School (CFHS), regarded nationally as a watershed event in the Obama administration’s school reform efforts, we must once again consider the success or failure of what followed (and preceded).

Progressives and ed reform skeptics are somewhat hamstrung in this process, as we tend to discount the validity of reformers’ goals and metrics. It often seems like wiser strategy to not accept their premises. Yet, if we ignore this data, we risk unilaterally disarming our own arguments or simply lessening our own understanding of the situation.

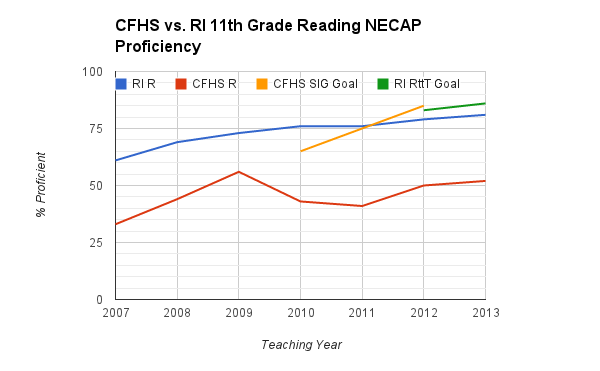
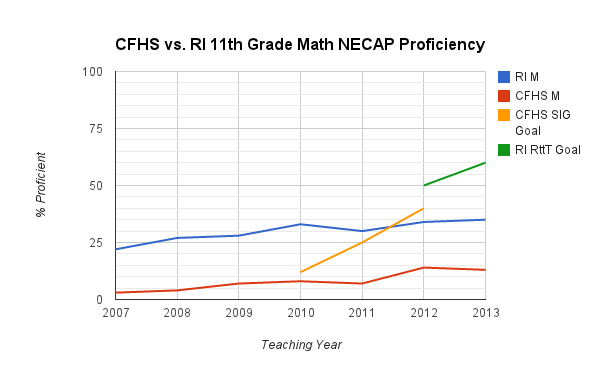
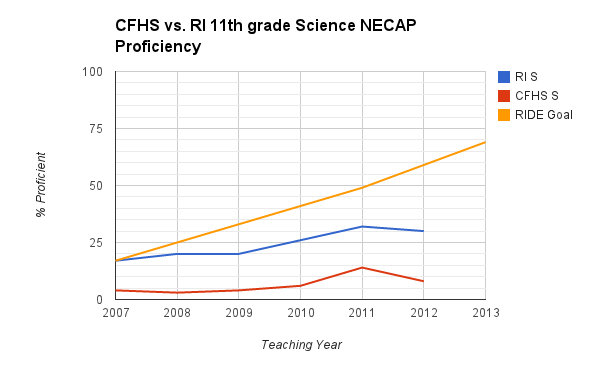
With that preamble, consider some charts tracking Central Falls High School 11th grade NECAP proficiency rates, compared to the statewide 11th grade proficiency rate to provide perspective on overall trends. 2007 through 2013 covers all the years the 11th grade NECAP has been administered statewide, all data from RIDE’s website.

In all these charts, CFHS is in red, RI public schools statewide in blue, where applicable, CFHS transformation plan goals in yellow and RI statewide Race to the Top goals in green.

chart_1 (1)

RIDE triggered the crisis in Central Falls following the application of the 2009 NECAP, either immediately before or after RIDE received the 2009 scores (it is hard to say which would be more irresponsible). As you can clearly see above, CFHS was named “persistently low-performing” after two consecutive years of double digit growth in reading proficiency, with a higher proficiency rate and lower achievement gap compared to the rest of the state than they have achieved since the transformation.

CFHS’s transformation plan hoped to “to sustain the rate of growth experienced in the past few years” while focusing their attention on math and other issues. This clearly did not work, and it has taken the school four years to approach the status quo ante in NECAP reading proficiency.

We all still pay to administer the NECAP writing assessment, but since it was not used for No Child Left Behind accountability, it has mostly been ignored by RIDE. Despite the lip service they may give to “multiple measures,” they cannot even be bothered to consider all the tests they administer. Regardless, as a relatively low-stakes, straightforward and authentic ELA test, it helps to corroborate trends in reading scores.

chart_2

While both CFHS and RI writing proficiency jumped in 2013, the gap between the two is still 8% greater than it was pre-transformation.

Increasing math proficiency was the academic focus of the transformation plan.

chart_3 (1)

While the authors of the plan stated “we are confident that our targets are reasonable” after consideration of “historical CFHS NECAP data… the proportion of students on the cusp of proficiency levels, and… statewide NECAP averages,” in retrospect, that was wishful thinking (or a politically necessary exaggeration). In reality, getting CFHS up to 14% proficiency is a substantial improvement based on a tremendous amount of hard work by students and teachers. But it is not what reformers projected after repeatedly citing CFHS’s 7% proficiency rate in 2009 as a justification for firing all the teachers.

For the NECAP science exam, I shifted the year label back a year to match with the fall test cadres above, and included the goals from RIDE’s strategic plan. The results are depressingly similar to the math test.

chart_2 (1)

Taking a longer perspective on the CFHS data, a few things seem clear:

  • The school’s academic performance prior to the transformation was not as bad as reformers thought or presented it.
  • Rushing the process did not “save” the students in the school. The test scores of the student cohorts in the school during the process clearly suffered. They were worse off in reading and writing achievement according to the NECAP scores.
  • In the four years since RIDE named CFHS “persistently low performing,” the gap between CFHS and RI state proficiency rates has increased on all four NECAP tests.

CFHS has had success improving their graduation rate, but it is important to note that while the four year graduation rate jumped 20% between the classes of 2010 and 2013, when most students in those cohorts took the NECAP in the junior year, the class of 2010 outperformed 2013 in NECAP reading and writing (in fall 2008 and fall 2011, respectively). The class of 2013 did outperform the class of 2010 by 3% in math and science, but there is no evidence that the 20% improvement in graduation rate was driven by increased student learning as measured by NECAP.

In short, dramatic changes have not created dramatically different results on RIDE’s NECAP assessment. It does not mean that nothing can improve urban high schools in Rhode Island, in fact, our recent track record includes some notable successes, including some all too fleetingly implemented at CFHS in the past twenty years, should we choose to re-examine them. But the “fire ’em all” Central Falls transformation has not worked, on its own terms, by its own standards.

Nobody knows how to increase 11th grade NECAP math scores


Deprecated: Function get_magic_quotes_gpc() is deprecated in /hermes/bosnacweb08/bosnacweb08bf/b1577/ipg.rifuturecom/RIFutureNew/wp-includes/formatting.php on line 4387

Deprecated: Function get_magic_quotes_gpc() is deprecated in /hermes/bosnacweb08/bosnacweb08bf/b1577/ipg.rifuturecom/RIFutureNew/wp-includes/formatting.php on line 4387

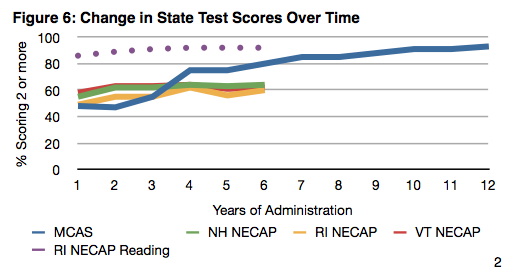
The most prominent and persuasive argument for using the 11th grade NECAP math test as a graduation requirement in RI high schools has been the relative success of Massuchusetts’ use of their MCAS exam for that purpose.  Last year I prepared a graph showing how Massachusetts student’s math MCAS scores increased over time compared to the NECAP math scores of RI, Vermont and New Hampshire.  It is important to note that Vermont and New Hampshire score in the top tier of states by virtually every measure of math achievement.

NECAP vs. MCAS

See where the percentage scoring at least “2” on the MCAS  jumps about 20% between years three and four?  That’s the graduation requirement kicked in for juniors.  The same effect in theory should have kicked in in year six (last year) for the RI NECAP, but there was no corresponding jump.

The 2013 NECAP results, which have been partially released on RIDE’s website, continue the past trend.  The number of 11th graders statewide scoring “1” or “substantially below proficient” decreased just 4% to 36%.  This is simply not enough progress to show the policy is working.  If you dig down to individual districts and charter schools — demographic and other in-district breakdowns are not available — it is even more disappointing (past years’ data from here):

  • The state’s flagship turnaround at Central Falls High School has the same number of students scoring “1” in 2013, 73%, as in 2008.  After all the turmoil, expense, and the reformers’ best effort, no change.
  • Providence Public Schools has bumped the “1’s” down from  67% in 2008 to 63% in 2013.
  • Barrington High School has only improved 4% since 2008: 12% to 8% scoring a “1” (compared to 1% in reading both years).
  • Blackstone Academy, a small (about 40 in the junior class) charter with 85% economically disadvantaged students, has levelled off after some impressive progress with about a third of juniors not meeting the graduation standard.
  • Paul Cuffee Charter School, a well-regarded new high school in Providence, still has 52% of juniors not scoring above a “1.”
  • A few districts had noticeably fewer students at “substantially below proficient” compared to 2012: North Providence from 44% to 26%; Pawtucket, 63% to 52%; Westerly, 29% to 17%.
  • But a other districts saw increases in students not meeting the requirement since last year: Exeter-West Greenwich, +9%; Newport, +4%; South Kingston, +3%.

I should hasten to note that my point here is not to do the typical blame and shame.  What seven years of 11th grade NECAP math scores tell me is that nobody has figured out how to increase them, especially among disadvantaged students, to an degree comparable to the MCAS and by enough to make the test an appropriate graduation requirement.

This is not supposed to happen.  Two of the fundamental premises of contemporary school reform are that students will rise to the level of expectations, and that incentives drive results.  We’ve got the expectations, the incentives could not be clearer or higher stakes to students and all the adult stakeholders and… the results are just not there.

To replicate the MCAS success story, North Providence’s 18 point improvement would have to be the average gain statewide, not an outlier.  When your highest flying low-income charter still has a third of its juniors not on track to graduate because of a single test, that’s not normal.  If RIDE knows how to increase 11th grade math NECAP scores, why haven’t they told Central Falls?  We’ve been paying outside consultants, too, like The Dana Center, who know as much about aligning math curriculum to standards as anyone.  Apparently they don’t know the answer either.

Exactly why we — and New Hampshire and Vermont — don’t seem to be able to raise 11th grade NECAP math scores is beside the point.  My theory is that 11th grade NECAP math scores reflect “fluid intelligence” more than the MCAS and other standardized tests, and teaching “fluid” skills like analyzing abstract problems and thinking logically in school is difficult and poorly understood.

Or perhaps the difference is simply that the MCAS was a problem designed with its own solution in mind.  The test was developed in parallel with a curriculum framework.  For schools to raise their MCAS scores, they needed to do a better job of delivering the state curriculum, which was not necessarily easy, but it was straightforward and achievable.  There is no equivalent map for increasing NECAP scores.

At this point, the burden of proof should pass to the proponents of the NECAP graduation requirement to lay out an evidence-based strategy for increasing the “pass” rate for NECAP math statewide by 20% that amounts to something other than “stay the course.”  We can’t have a third or more of seniors not knowing if they’re going to graduate in February or scrambling for waivers.  For this to work, we need Barrington at 99% pass, Westerly and Blackstone Academy at 95%, and Central Falls and Providence  need to nearly double the number of students getting over the bar.  Maybe it is possible.  Tell me how.  I don’t see it.

And of course, it is a moot point since RI is moving off the NECAP as soon as possible anyhow. So… seriously, why are we doing this to ourselves?

This Common Core chicken little is tired of bogus international comparisons


Deprecated: Function get_magic_quotes_gpc() is deprecated in /hermes/bosnacweb08/bosnacweb08bf/b1577/ipg.rifuturecom/RIFutureNew/wp-includes/formatting.php on line 4387

Deprecated: Function get_magic_quotes_gpc() is deprecated in /hermes/bosnacweb08/bosnacweb08bf/b1577/ipg.rifuturecom/RIFutureNew/wp-includes/formatting.php on line 4387

julia steinyI feel compelled to respond to Julia Steiny’s recent GoLocalProv column Common Core Standards Freak Out Chicken Littles. I will focus on English/Language Arts, because that is my area of expertise.

Ms. Steiny completely misrepresents the facts regarding the ubiquity of national standards globally, stating “All the countries with whom American students are compared have national standards and even national curricula (Finland). Weirdly, national standards are about the only thing those countries’ education systems have in common.”

In the international benchmarking of the Common Core College and Career Readiness Standards for ELA/Literacy by the standards’ authors, they cite documents from eight “high performing” systems: two small countries – Finland and Ireland; five provinces – Alberta, British Columbia, New South Wales, Ontario, and Victoria; and one “special administrative district” of China – Hong Kong. England, Scotland and Wales have different documents.  Shanghai is a province-level municipality. Singapore is a city-state with roughly the population of Minnesota. National standards are clearly not universal, particularly in the high performing countries most similar to the US.

In fact, American educational technocrats have adopted a conceptual model quite different from our competitors. None of the provinces or countries cited by CCSSI countries considers itself to use “standards” at all. In each case their documents are considered curriculum frameworks, outlines or syllabi, with “outcomes,” not standards.  Outcomes are broadly defined, usually within a sequence of courses. For example, Finland defines a compulsory course for high school students called “A world of texts,” with the following objectives:

  • The objectives of the course are for students to
  • understand the meaning of a broad conception of text;
  • consolidate their awareness of different genres;
  • be aware of different ways of reading, analysing, interpreting and producing texts;
  • learn to choose the style of language as required in each specific situation;
  • learn to interpret narrative texts;
  • learn the principles of placing their own contributions in relation to texts written by other people;
  • participate constructively in group discussions.

To illustrate the difference in approach, the Common Core standards for reading literature in 11th and 12th grade read like this:

CCSS.ELA-Literacy.RL.11-12.3 Analyze the impact of the author’s choices regarding how to develop and relate elements of a story or drama (e.g., where a story is set, how the action is ordered, how the characters are introduced and developed).

CCSS.ELA-Literacy.RL.11-12.5 Analyze how an author’s choices concerning how to structure specific parts of a text (e.g., the choice of where to begin or end a story, the choice to provide a comedic or tragic resolution) contribute to its overall structure and meaning as well as its aesthetic impact.

CCSS.ELA-Literacy.RL.11-12.7 Analyze multiple interpretations of a story, drama, or poem (e.g., recorded or live production of a play or recorded novel or poetry), evaluating how each version interprets the source text. (Include at least one play by Shakespeare and one play by an American dramatist.)

CCSS.ELA-Literacy.RL.11-12.10 By the end of grade 12, read and comprehend literature, including stories, dramas, and poems, at the high end of the grades 11-CCR text complexity band independently and proficiently.

The point is not that the Common Core represents bad tasks that students shouldn’t doing. It is that other countries like Finland have a fundamentally different approach.  They don’t use standards as levers to force system-wide accountability and compliance.  Our method is imposing specific tasks and assessment targets sets us apart. What evidence there is indicates that the broader curriculum-based approach works just fine, yet if you proposed Finland’s outcomes in any state department of education in the US, you’d be laughed out of the room.

Nor do any high performing countries view the goal of their English Language Arts curricula to be merely “college and career readiness,” as Rhode Island has embraced with the Common Core. Even our most authoritarian peers manage to leave room for creativity, self-expression, and experiencing aesthetic pleasure as fundamental goals of their curricula. We do not. Ironically, our Asian competitors in particular seem to at least understand the economic imperative of the arts, while we seem to be walking away from even that utilitarian angle. If you want to see something more similar to the Common Core, you should look at the NECAP Grade Level Expectations (GLEs).

Despite the lengths to which some will go to claim otherwise, the NECAP GLEs represent the US technocrat consensus on standards design circa 2005, and the Common Core standards represent the US technocrat consensus on standards design circa 2010. If they were very different, it would be quite surprising. In fact, in 2007 Governor Carcieri joined the board of Achieve, one of the main drivers of the Common Core process. Their press release noted that “In February 2005, Governor Carcieri committed Rhode Island to join Achieve’s American Diploma Project Network, a coalition of 29 states committed to aligning high school standards, assessments, curriculum and accountability with the demands of postsecondary education and work.” The American Diploma Project was the direct pre-cursor to Common Core.

This is evolution, or perhaps devolution, but hardly revolution. There will be one clear result of adopting the Common Core standards. Instead of only having the 11th grade NECAP math test telling us only 30% of our students meet the standards, we’ll have new tests that tell us only 30% meet the standards at every grade level in reading, writing and math. At least that will be more consistent.