The election of 2004 (Part 5 of MMP RI)

Voter percentages from 2004. DEM = Democratic Party, GOP = Republican Party, IND = Independent, LIB = Libertarian Party, GRN = Green Party. Some percentages add up above 100% due to rounding. (via Samuel G. Howard)
Voter percentages from 2004. DEM = Democratic Party, GOP = Republican Party, IND = Independent, GRN = Green Party, W-I = Write-In. Some percentages add up above 100% due to rounding. (via Samuel G. Howard)

Turnout was expected to be high in a presidential election year. The Iraq War, which had seen a nation toppled in less than a month, was entering a bloody phase. In April, the US Marines had been defeated at Fallujah, almost exactly a year after President Bush had declared “Mission Accomplished” aboard the USS Abraham Lincoln. Sen. John Kerry of Massachusetts attempted to hold Bush to one term, in a divisive election that helped solidify the idea of a “red state-blue state” divide in America.

Though Rhode Island was decisively a blue state, a dispute between Providence’s firefighters and Mayor Cicilline prevented Vice Presidential candidate John Edwards from visiting Rhode Island, as he refused to cross the union picket line.

In the General Assembly, Democrats lost seats, even as they won a new seat in Senate. Republicans seized upon that seat gain to suggest that redistricting was a problem; how had Democrats managed to gain a new district seat if their share of the votes had gone down? Democrats countered with the fact that a renewed emphasis on contesting seats had yielded the Republican four new district seats, defeating four Democrats in head-to-head races. Perhaps if Republicans focused on running instead of complaining, they might do better.

In total, Republicans gained two seats in the Senate and five seats in the House. Republicans told their members they were doing better, and the end of Democratic control was coming soon. Democrats grumbled.

Implications

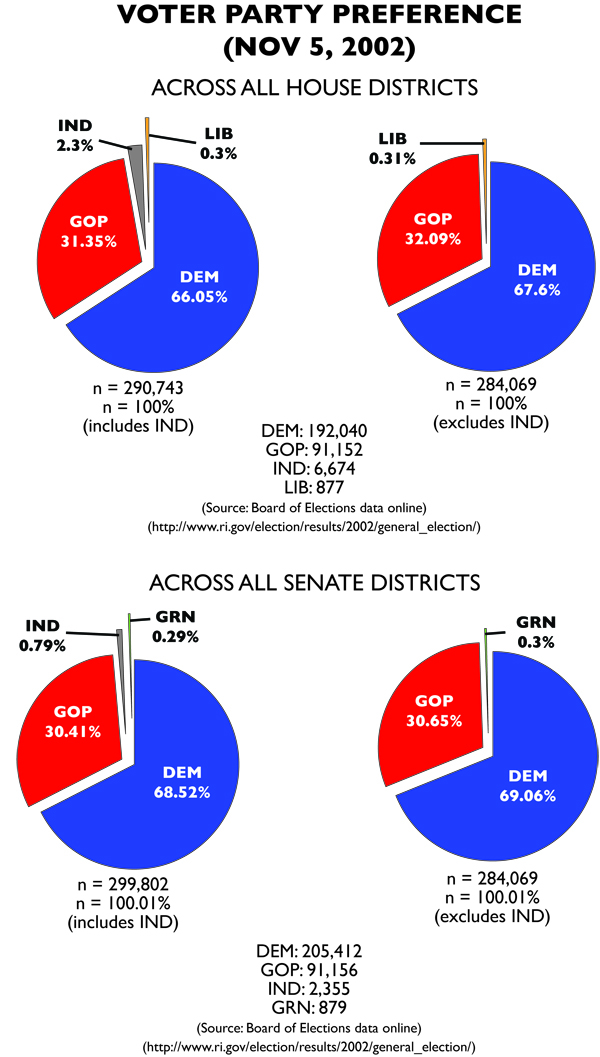
In reality, though the Republicans gained four seats in the House, they actually lost a seat in the Senate. 2004 was the high watermark for Republican turnout, not as a percent wise, but total votes. In both House and Senate races, over 120,000 people cast their votes for Republican candidates. Collectively, Republican candidates tend to must 30,000 to 20,000 votes less. Though Republicans managed to turnout in large numbers, Democrats turnout in even higher numbers, improving somewhere around 40,000 voters over 2002.

RI GA apportioned according to the D'Hondt method. (via Samuel G. Howard)
RI GA apportioned according to the D’Hondt method. (via Samuel G. Howard)


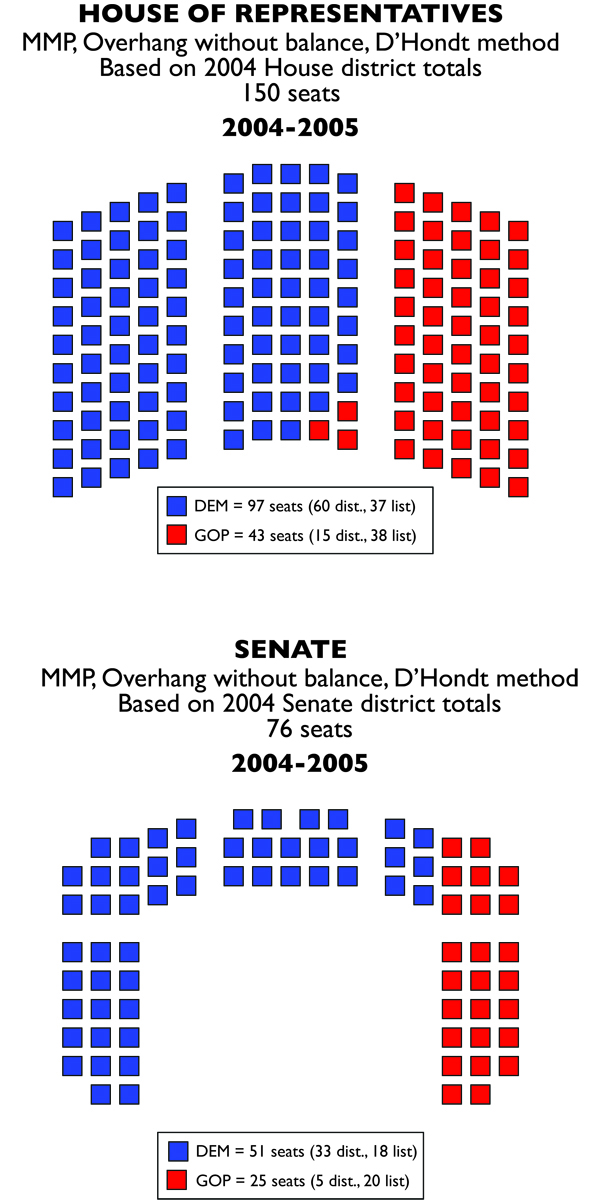
This is Part 5 of the MMP RI series, which posits what Rhode Island’s political landscape would look like if we had switched to a mixed-member proportional representation (MMP) system in 2002. Part 4 (the Election of 2002) is available here. Part 6 is a look at the Election of 2006.

The election of 2002 (Part 4 of MMP RI)

Voter percentages from 2002 (via Samuel G. Howard)
Voter percentages from 2002. DEM = Democratic Party, GOP = Republican Party, IND = Independent, LIB = Libertarian Party, GRN = Green Party. Some percentages add up above 100% due to rounding. (via Samuel G. Howard)

2002 was a momentous year for Rhode Island politics. State Representative David Cicilline announced he would challenge Buddy Cianci for Mayor of Providence. The capital city was also seeing a coalition of left-wing voters working to elect a young Green Party candidate David Segal to the city council. The major battle was between liberal standard-bearer former state Sen. Myrth York and conservative businessman Donald Carcieri.

In this atmosphere of change, so too was the General Assembly changing. Though its number of districts had been downsized, nearly a decade prior voters had approved an expansion of the Assembly; both chambers would practically grow by half.

The results of the election were stunning. Carcieri triumphed over York, who underperformed among Democrats. Cianci was eliminated before election day after being found guilty of racketeering conspiracy; after overcoming a primary election, Cicilline cruised to victory. Segal entered the Providence City Council as the minority leader, the sole member whose party wasn’t “Democrat”.

And in the General Assembly, the change was hard to interpret. Certainly, neither party “lost” seats. And yet, proportionally, the Republicans were stronger than they would have been in the old FPTP system. Instead of controlling a mere 14.67% of the seats in the House, they controlled 32% of the seats. In the Senate, the old way would’ve seen them earn 15.79% of the seats. The new method assigned them 30.26% of the seats.

However, the vast majority of Republican seats were from the party list, not from districts. Failure to contest as many seats meant that their candidates were more beholden to party, rather than to constituency. The Democrats had the opposite issue; their victory in the districts meant that they assigned fewer from the lists. The Democratic delegation would be mostly made up of incumbents, while the new Republicans would be mostly fresh-faced.

The Republicans claimed victory. Here was proof that Rhode Island’s corrupt system had prevented the full choice of the voters from being acknowledged. Democrats, for their part, grumbled, and went home with a slim supermajority of the General Assembly seats.

Implications

In reality, Democrats controlled roughly 85 percent of each chamber. Republicans were essentially shunted aside, even while winning slightly less than a third of the vote. So they controlled half of what they should have in the Assembly proportional to the votes they received.

In retrospect, it seems odd that the impetus for the General Assembly being shrunk was to create greater competition for seats. Mainly, because it failed to work; about a quarter of Senate seats were uncontested (10) as were a third of House seats (34).

RI GA apportioned according to the D'Hondt method
RI GA apportioned according to the D’Hondt method. (via Samuel G. Howard)


This is Part 4 of the MMP RI series, which posits what Rhode Island’s political landscape would look like if we had switched to a mixed-member proportional representation (MMP) system in 2002. Part 3 (an explanation of MMP and an account of the methods used to create these posts) is available here. Part 5 is a look at the Election of 2004.

What is mixed-member proportional representation? (Part 3 of MMP RI)


Deprecated: Function get_magic_quotes_gpc() is deprecated in /hermes/bosnacweb08/bosnacweb08bf/b1577/ipg.rifuturecom/RIFutureNew/wp-includes/formatting.php on line 4387

Deprecated: Function get_magic_quotes_gpc() is deprecated in /hermes/bosnacweb08/bosnacweb08bf/b1577/ipg.rifuturecom/RIFutureNew/wp-includes/formatting.php on line 4387
The German Bundestag uses MMP

Imagine that in 1994 voters had approved similar constitutional amendments to those they did. The House would be reduced to 75 districts, and the Senate would be reduced to 38. However, both chambers would actually end up expanded; as the House would receive 75 additional seats and the Senate 38 additional seats.

These seats wouldn’t be attached to districts, but rather they’d be apportioned based on the total vote a party collected across all races for each chamber. Thus if the Democrats won 60% of all votes cast in Senate races and 70% of all votes cast in House races, they could expect a roughly proportional number of seats in the Senate and House.

The results of the district races would be unchanged, and the legislature would grow above the 150 seats in the House and 76 in the Senate based on those results. Thus if an independent candidate won a race, they’d still take their seat, but the legislature would grow by one seat to accommodate them while keeping the party balance roughly even to the vote for parties.

The non-districted seats would be filled from a list of candidates selected by the parties. How the parties selected these candidates would be entirely up to them.

What I’ve just described is roughly how the West German Bundestag set up as its electoral system following World War II. Most of its state legislatures did the same.

Initially, the Bundestag used the system described above, where the votes cast in the district races were used to calculate how the list seats should be apportioned. However, this has since been changed to having a separate vote for party preference. This allows voters to think strategically in their votes in the district races, while still being able to vote for their favorite party. Unfortunately, we can’t do more than guess how voters would select the favorite party, so I’ve chosen to use the original Bundestag system.

There’s a bit more though. It’s not as simple as “you get 40% of the vote, you get 40% of the seats.” There are multiple ways of calculating how many seats a party should get. I chose the D’Hondt method, which is a highest averages method. The D’Hondt method favors large parties and disadvantages smaller parties, which I thought would be appropriate to how our electoral system is already setup.

Many electoral systems also feature a “threshold,” requiring a party gain a certain proportion of votes before it can gain seats. Typically, this is set at 5%. In this case, I’ve left out a threshold. I feel if this really were implemented, there would be a threshold, but I felt it would be more interesting to see whether any third party could break into the General Assembly without that extra hurdle. Currently, Rhode Island political parties require 5% of the statewide vote in either the US Presidential race or the Governor’s race to be recognized as a state party.

Post continues on next page (or click below)

Trends from last 6 RI elections (Part 2, MMP RI)


Deprecated: Function get_magic_quotes_gpc() is deprecated in /hermes/bosnacweb08/bosnacweb08bf/b1577/ipg.rifuturecom/RIFutureNew/wp-includes/formatting.php on line 4387

Deprecated: Function get_magic_quotes_gpc() is deprecated in /hermes/bosnacweb08/bosnacweb08bf/b1577/ipg.rifuturecom/RIFutureNew/wp-includes/formatting.php on line 4387

Senate_ChmbrIn 2002, the General Assembly was re-shaped as a result of constitutional amendments approved by voters in 1994. Ostensibly the amendments were passed to increase competition for seats in both chambers; yet over the past six general elections 32.02% of Senate seats have gone uncontested on average, along with 37.33% of seats in the House.

While common wisdom might be that this type of apathy has benefited Democrats, that’s only half true. In the House of Representatives, both parties have benefited proportionally from this apathy; an average of 37.34% of House Democrats have not faced a general election challenger since 2002. House Republicans have an average of 36.04% over the same period. The difference is negligible.

The Senate is where there is disproportion. Since 2002, an average of 35.74% of Senate Democrats have had uncontested general elections. Senate Republicans have only averaged 18.06%. Why this might be is unclear to me; with a larger district, Senate candidates should require more resources to reach their constituents, meaning House races should be cheaper and thus more accessible.

Alternatively, the large Senate districts mean a larger pool of potential candidates, and the prospect of well-gerrymandered districts combined with a Democratic advantage in voter registration could assist Democrats in generating opponents for Republican candidates while keeping Republicans from contesting Senate elections.

The data gets more revealing of our current state of affairs when one calculates statewide votes cast for each party in each chamber of the General Assembly.

Democratic control over the General Assembly chambers has been extremely disproportional to the actual votes they’ve received. While Democrats typically win about 65% of the vote across Rhode Island when the results of all districts are added together, their control of the chambers is about 20 points higher, hovering around 85% of all the seats in each chamber.

At the same time, Rhode Island has seen a number of third parties compete for seats in the General Assembly; the Greens, the Socialists, the Libertarians, and the Moderates. Only the Moderates have captured above a percentage point of the statewide vote when calculated across all districts.

One final trend has emerged over the past six elections since the General Assembly was reduced. There’s been a growth in votes cast for independents since 2008, with all independent candidates capturing above 4.5% of the vote each of the last three elections. In the three elections prior, independents never managed to eke out above 3.7% of the vote, and were often well under 1%.

It’s possible that there’s a growing discontent with the Democratic Party, which combined with a dislike of the Republican Party, is boosting independents. It’s also possible that as the Millennial Generation began voting in the late 2000s, it’s turned more towards independents than its predecessors. Remember, Millennials were becoming aware of politics in the era between the Clinton Impeachment and the Iraq War; both of which were extreme blows to the credibility of the political establishment. Alternatively, I could be dead wrong.

You can take a look at the spreadsheets I created for yourself:

Post continues on next page (or click below)

What If RI had a different electoral system? (Part 1 of MMP RI)


Deprecated: Function get_magic_quotes_gpc() is deprecated in /hermes/bosnacweb08/bosnacweb08bf/b1577/ipg.rifuturecom/RIFutureNew/wp-includes/formatting.php on line 4387

Deprecated: Function get_magic_quotes_gpc() is deprecated in /hermes/bosnacweb08/bosnacweb08bf/b1577/ipg.rifuturecom/RIFutureNew/wp-includes/formatting.php on line 4387
Example ballot for a mixed-member proportional representation system (via Wikipedia)
Example ballot of a mixed-member proportional representation system (via Wikipedia)

Rhode Island is entering the 2014 election cycle with major decisions to make. First, there will be the election of all of the state’s general officers. Second, there will be the usual elections of the entirety of the the General Assembly; commonplace as it may be, it has a major impact on Rhode Island. Thirdly, there is a requirement to ask whether Rhode Islanders want to hold a constitutional convention.

The last that is the most important. A lot of things will be at play here. There is impetus for reform across the political spectrum. Which means many competing interests as to what should be changed and why and how.

There’s also the issue that there’s an established political set that may not want to see large-scale reform, and that will also matter.

Then that each delegate will be elected from across the 75 Rhode Island House districts drawn after the 2010 US Census, meaning that many of the dynamics that go into House races will apply to the race for the delegates.

Finally, we should take into consideration that a constitutional convention cannot fundamentally transform power dynamics. What it can do is transform how those dynamics play out. Thus, the abolition of slavery and acknowledgement that all Americans were equal didn’t suddenly equalize all Americans. What it did do is prevent the enslavement of black Americans. It took a hundred years of resistance to bring about legislation that would guarantee equal access to rights, and even then the structures built up during the whole of American history continue to discriminate.

What I specifically want to look at in this series are constitutional changes that transform elections; which can best be described as transforming how (and which) citizens can access the power of the state. Specifically, I want to create a picture of how the General Assembly would look under a different electoral system; one that prized balancing the General Assembly to the votes for each party.

This system is known as mixed-member proportional representation (MMP). It’s not the be-all and end-all of electoral systems, but it’s better than the current system, which is known as plurality voting or “first-past-the-post” (FPTP). I’ll explain the difference in a bit. But first, I want to talk about the last six elections in Rhode Island.

This is Part 1 of the MMP RI series, which posits what Rhode Island’s political landscape would look like if we had switched to a mixed-member proportional representation (MMP) system in 2002. Part 2 is a retrospective of the last six elections.