Why it’s harder to get a better score on NECAP math retest


Deprecated: Function get_magic_quotes_gpc() is deprecated in /hermes/bosnacweb08/bosnacweb08bf/b1577/ipg.rifuturecom/RIFutureNew/wp-includes/formatting.php on line 4387

Deprecated: Function get_magic_quotes_gpc() is deprecated in /hermes/bosnacweb08/bosnacweb08bf/b1577/ipg.rifuturecom/RIFutureNew/wp-includes/formatting.php on line 4387

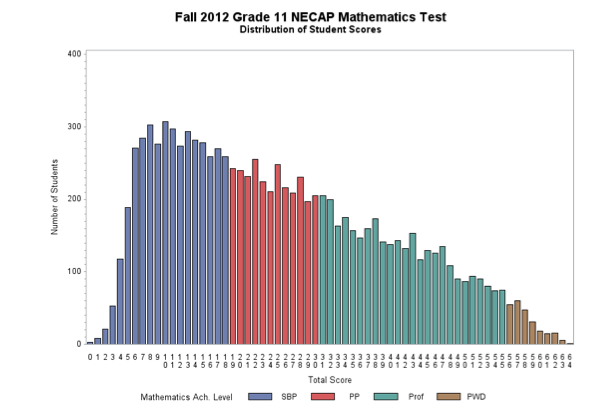
Now that we are in the period of NECAP retesting for seniors who failed the test as juniors, it would be good to take a look at how the math test is constructed. Because that, after all, is the test most juniors failed in the first place. In the chart below you can see how students did, item-by-item, when they took the NECAP grade 11 math test in 2012.

2012 necap math test

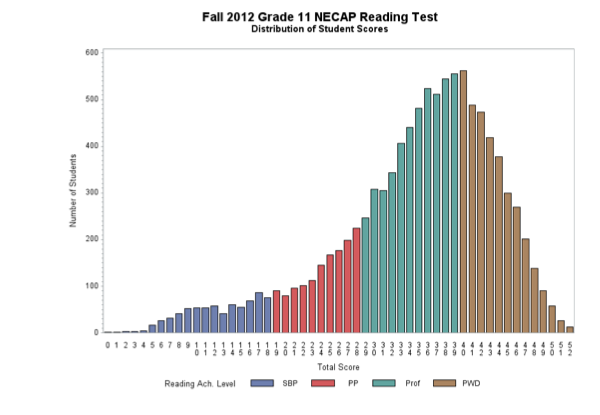
The thing that shoots off the page is that the curve shown in the chart doesn’t look much like a normal curve. If you remember, a normal curve is described as a “bell shaped curve”, meaning it is symmetrical, highest in the middle, and slopes downward to the right and left. To see a bell curve, look at the reading test results shown below the math test: it’s not a perfect curve, being squished a little on the left, but at least it’s some version of a normal curve.

What we see above is definitely not symmetrical, nor does is slope downward to the right and to the left—to the right, yes, there is a long, straight slope, but to the left there is a precipitous drop. Altogether, it looks like a wedge with its thin edge to the right.

What does a wedge shape mean to a student taking the test? The numbers below the bars tell you how many students got a particular item correct and you can see that very few students only got item “1” correct. But thereafter, things change dramatically and the numbers of students getting very low numbers of items correct stacks up like 95 at rush hour. In fact, in the math test, the scores the most students got were between 7 and 11 items correct—out of a possible 64! More than 300 students only got 9 items correct.

What this tells us is that the math test has no lead-up of items that gradually get more difficult. Instead, it begins with difficult items and then makes each item more difficult, which accounts for the almost straight line of descending scores to the right. This design—hard items and then harder items—makes it difficult for students to do better without putting big resources into remediation efforts of doubtful long- term value.

Defenders of the NECAP math test say the problem is not the test but the education system—bad teachers, essentially. Part of their defense rests on showing questions that students who fail the test get wrong. Adults who see these items tend to solve them and think that of course most students should get them right. But this is a bogus exercise–the adults who see these items are never in the pressurized testing environment where students encounter them, so it should not be taken seriously as a defense of the math test.

Instead, look at the reading test, shown below. It’s hard to look at the two graphs and believe the reading and math test are constructed using the same design. In the reading test, the long tail to the left indicates a run-up of easier questions and, in this situation, improving performance between tests would be a much less difficult task. The remediation might not be any more educationally meaningful, but there would be less of it, it would be less difficult to provide, and it would divert much less time, energy and money. Indeed, that is what happened.

2012 necap math 2

The NECAP math test is wrong


Deprecated: Function get_magic_quotes_gpc() is deprecated in /hermes/bosnacweb08/bosnacweb08bf/b1577/ipg.rifuturecom/RIFutureNew/wp-includes/formatting.php on line 4387

Deprecated: Function get_magic_quotes_gpc() is deprecated in /hermes/bosnacweb08/bosnacweb08bf/b1577/ipg.rifuturecom/RIFutureNew/wp-includes/formatting.php on line 4387

Recent remarks in the Journal by the Commissioner of Education point a finger away from the NECAP and toward math education in this state, “Gist said that math is the problem, not the NECAP. ‘This is not about testing,’ she said. ‘It’s about math. It’s about reading.” (Jan. 31, 2014).

A statement like this puts everyone on notice. It tells our students they had better try harder; it tells our teachers they need to stay on track and get better results; and it tells our schools they need to raise their test scores. The subtext of the statement is that there is a big crises and just about everyone in the school system is to blame.

And just behind this subtext is the further ominous and obvious subtext that everyone in the schools needs to be held accountable until we get out of this mess.

But what kind of a mess are we in? What if our low math scores are the result of how we measure math instead of how we teach math? If that is the case, there is much less of a crises and the argument for holding everyone to high stakes accountablity–students don’t graduate, teachers get fired, schools get taken over–

has much less traction.

Since a lot rides on the answer to this question—is it the way we teach math or is it the way we measure math?—it’s worthwhile trying to answer it.

One way to go about this is to compare the performance standards set by different tests. A performance standard is sometimes expressed as a grade level, as in, “the proficiency level of the grade 11 NECAP is set at a ninth grade level”. In this case, a student demonstrating proficiency would show us that he or she has mastered the expectations of a student completing ninth grade. That is, the student would get most of the questions with ninth grade content and ninth grade difficulty right, but would get many fewer questions set at higher levels of difficulty or questions covering topics not usually taught until tenth grade or later.

The way this would show up on a test would be in the average score of the students taking the test—a test set at ninth grade proficieny would have a higher average score than a test set at the eleventh grade proficiency level if they are taken by the same group of students. That makes sense–the eleventh grade standard for proficiency is harder than the ninth grade level because students have covered more content and developed stronger skills.

Back to the basic question—is it the way we teach math or the way we measure math? If we look at the way the NECAP measures reading, we can see that in the two states that take the test in grade 11, New Hampshire and Rhode Island, about 80% of students achieve proficiency. If we say 80% achieving proficiency indicates the test is at an eleventh grade level, then we have to wonder about the NAEP results students in these states achieve because less than half achieve proficiency.

We then have to ask ourselves, what performance standard is NECAP using? Whatever it is, it is much lower than the performance standard NAEP uses because a much higher percentage of students pass. In fact. over 80% more students pass NECAP than pass NAEP, so you can think of the NECAP performace standard as almost twice as easy as the NAEP performance standard. The tests are using different performance standards.

math necap chart

If you look at math, the results are startlingly different—here the percentages passing NECAP and NAEP as very comparable, meaning both tests use the same performance standard. And if you look at the NAEP reading and math performance standards, they are pretty comparable, with reading a little higher than math.

It looks like NAEP, the national measuring stick, uses about the same performance standard for reading and math while the NECAP does not.

Now, you can argue that NECAP has set the math performance standard right and has used a reading standard that is too easy. Then, of course, we would have a reading and a math problem instead of just a math problem.

But either admitting the math standard is too hard or the reading standard is too easy would mean admitting that something is wrong with the way NECAP standards have been set, something the Department of Education and the Commissioner have steadfastly denied.

I think that, at heart, they have denied such an obvious fact because it is too costly to their policy agenda to admit that anything could be wrong with the tests.

To do so would be to cast doubt on the expertise of the test designers who are the ultimate source of authority in the accountability debate. If test designers are wrong and tests are fallible, then how we measure students, teachers and schools is up for grabs. RIDE loses its top down leverage.

In the same article, Gist said, “Now is not the time to rethink our strategy.”

“Holding students accountable is really important,” she said. “We cannot reduce expectations.” The Chairman of the Board of Education, Eva Mancuso echoed the thought, “We are on the right course.” This sounds like a comment from the bridge of the Titanic.

Math versus morality


Deprecated: Function get_magic_quotes_gpc() is deprecated in /hermes/bosnacweb08/bosnacweb08bf/b1577/ipg.rifuturecom/RIFutureNew/wp-includes/formatting.php on line 4387

Deprecated: Function get_magic_quotes_gpc() is deprecated in /hermes/bosnacweb08/bosnacweb08bf/b1577/ipg.rifuturecom/RIFutureNew/wp-includes/formatting.php on line 4387

enron pension“The pension reform debate is … a dispute over which members of society will have to make sacrifices and which ones will not,” Rolling Stone magazine’s Matt Taibbi tells GoLocalProv.

Long before Ted Seidle parsed pension cuts as a wealth transfer from Rhode Islanders to hedge fund managers, this was the non-labor left’s biggest issue with the struggle to save public sector retirement security by taking money away from public sector retirees. It is inherently wrong to ask the people who played by the rules (labor) to fit the bill for those who didn’t (management).

I would argue that Raimondo’s star power, bolstered by anonymous out-of-town money and an adoring local media unwittingly conspired to make a very regressive pension reform proposal seem the only sensible thing to support. There is math component to the political problem that is pension reform in that a deficit exists. But the morality part is what we do about that. All too often in today’s political climate, very powerful people spend a lot of money saying the way to fix this deficit is to take from the poor and give to the rich.

Personally, I’d much prefer to live in a financially bankrupt society than a morally bankrupt one and by foisting all the responsibility on retirees, Rhode Island legislators may have made prudent moves away from the former, but they also made foolish leaps toward the latter.

Here’s Taibbi’s response in GoLocal:

For the record, I appreciate Treasurer Raimondo’s thorough response. I understand this is a tough issue and there are heated opinions on all sides. She was gracious enough to speak to me at some length before the article came out, and she did so probably knowing that the article was going to be critical. She clearly believes she is pursuing the correct policies and the fact that she was and is willing to openly engage critics in discussions about those policies is absolutely to her credit.

However, nothing in the response released by her spokesperson Joy Fox yesterday makes me believe that we got the story wrong.

Raimondo dismisses me and her union critics as politically and ideologically motivated, which is fine and understandable. But she doesn’t acknowledge that her own decisions and policies are similarly political and ideological. She presents herself as merely a technocrat who “puts politics aside” to do what’s best for Rhode Island.

But this is wrong on its face. The pension reform debate is the ultimate political and ideological argument. It’s a bitter fight over resources, a dispute over which members of society will have to make sacrifices and which ones will not.

The advocates of pension reform, not just in Rhode Island but across the country, believe that ordinary public workers — teachers, police, firemen — are inherently overcompensated, politically over-empowered by unions, and receive unsustainably high incomes and benefits. They also believe that the solution to the nation’s fiscal problems lay in asking these workers to make the first financial sacrifices — something Raimondo (like other politicians in other states) often describes as “making tough choices.” (By coincidence, these tough choices also seem quite often to involve privatizing large amounts of public retirement money into the hands of the financiers who stand behind these politician-advocates of pension reform.)

All of this falls in line with certain trends in political thought nationwide. A lot of people these days genuinely believe we must invest in employers first and foremost, and that ordinary wage-earners, public or private, are essentially drains on the bottom line, whose benefits especially are luxuries we can’t afford.

It would be silly to deny that a lot of people find this ideology convincing. But it’s certainly an ideology. That’s why it’s disingenuous when Treasurer Raimondo describes my article as political propaganda, when she had no such reservations about the public relations efforts of organizations like EngageRI and the Manhattan Institute, groups that not only supported her politically, but which have clear financial interests in this debate. But this a common tactic, dismissing critics of pension reform as ideologues clouded by frustration and unreason, while pension reform itself — well, that’s just math.

Having interviewed public workers in Rhode Island and in many other states, I know that state employees on the whole are absolutely willing to make sacrifices, if they’re needed to help states get out of fiscal crises. What they resent is being told they’re the cause of these crises and that the size of the sacrifices they must make is beyond debate and just mathematical fact. Time and again, when they ask questions about the reform plans, they’re dismissed as recalcitrant ideologues unwilling to accept reality. This is condescending and I think they’re right to be angry about it. Talking about omitting facts, most of these people haven’t been told even part of the story about the widespread crime and fraud in the mortgage/finance sector that caused the crash and put the retirement savings of people all over the country in jeopardy. Going forward, they were also not told about things like high management fees, the role of consultants and placement agents, and other such dubious nooks and crannies of pension reform.

All of which is a long-winded way of saying that I think politicians like Raimondo would do better to stop pretending that pension reform is somehow not about politics. This whole thing is political, on all sides.

And here is the comment from Raimondo’s spokeswoman Joy Fox he was responding to:

This is clearly a political propaganda piece driven by the critics of pension reform, including those who are paid by local labor leaders to discredit the state’s reforms and its investment policies. The author does not appear to have a clear understanding of the 2011 pension process and its goals, and conveniently omits many important facts.

The Treasurer stands by the work of the General Assembly to provide retirement security for hardworking public employees and retirees.

This story also unfortunately glosses over what actually happens to people when leaders do not make tough choices. The retirees of the City of Central Falls saw their pensions cut in half. Leaders do not want the same to happen again to public employees and retirees in the state system.

In 2011, Rhode Island had a choice. It could have done nothing and been dishonest about its problem. Instead, Rhode Island leaders came together, courageously put politics aside, and made the tough decision to protect the retirements of hard working public employees and retirees.”

It is important to remember:
– The treasurer fought to always keep a defined benefit pension, and always respected collective bargaining.
– Reform passed overwhelmingly in a Democrat-controlled General Assembly
– There were countless hours of labor-attended pension advisory group meetings, legislative hearings and town hall-style meetings with the Treasurer and Governor
– All but one vote to approve the hedge funds were unanimous. The only vote to approve hedge funds that was not unanimous was due to one abstention – again, showing strong SIC support to execute this investment strategy.