 A few days ago, I wrote about the NECAP test, and the statistical goals of its designers. Since then, I’ve been called “not a psychometrician” on the radio, among other things. I hear that Monday I was insulted on John DePetro’s show, too. So I thought I’d provide accounts of what a couple of psychometricians have had to say about what I wrote.
First we’ll hear from Charles DePascale. He works in New Hampshire, for the Center for Assessment (nciea.org), and is apparently the consultant to the Rhode Island Department of Education (RIDE) on all matters NECAP.
He wrote up a critique, and RIDE has been sharing it with reporters. They wouldn’t share it with me, though the department spokesguy, Elliot Krieger, told me they’d “consider” any open records request I made for public documents. But fortunately, reporters seem to be more interested in the free flow of information, and you can see the document here. (Elisabeth Harrison of RI Public Radio writes about it here.) It is unsigned in the document body, presumably since DePascale doesn’t speak for the department, according to Krieger, who does speak for them.
The document, whoever wrote it, makes three main points:
- The NECAP is not a norm-referenced test, so the number of kids who flunk is a function of their abilities and instruction, not a function of the test design.
- The statistical significance of the results means that you can be confident that a student will not be mistakenly flunked.
- Performance on the 11th-grade reading test is what you’d expect for a graduation test, therefore the math test, designed the same way, is also fine.
Also, I said that only 9 out of 22 questions (40%) on the 11th grade math test were answered correctly by more than half the students, but in a direct blow to the central premise of my argument, DePascale says I have it all wrong, it was actually 19 out of 46 (41%). I dragged myself to the ropes, a beaten man, devastated by the force of his argument… well never mind all that.
To the first point, he is exactly right. And here, we will descend into some jargon, but please follow me, because it’s important. The NECAP is, indeed, what test designers call a “criterion-referenced” test. A student’s score on the test is referenced to a standard, not to the other test-takers. The SAT, for example, is a “norm-referenced” test, where a student is graded on their performance relative to other students. On a norm-referenced test, a fixed percentage of test-takers will flunk, almost by definition.
The NECAP is not that, and I never meant to imply that it was. I’m afraid I did use the word “certain” to describe the number of students who flunk the NECAP in one summary sentence, and that was a poor choice of words that I tried to clarify here. It is still perfectly sound advice that if you want to rank performance on a test, you do what you can to spread out the performers. This is not a point of advanced psychometrics, this is a point of basic statistical analysis, even common sense. The NECAP test designers put their test together to maximize the spread between students, for all the statistical reasons I wrote about. They do so in the questions they choose, not in the grading, as a norm-referenced test would do, and the care with which they analyze the per-question results demonstrates how careful they are.
Obviously, if you’re grading against an absolute standard, it is conceivable for all test takers to ace it, and DePascale makes that point. But the NECAP test designers have done what they can to make that highly unlikely, for perfectly valid statistical reasons, and that makes it a bad graduation test. That’s what I meant, and I stand by it, largely because I still haven’t seen anyone convincingly state otherwise.
With regard to the second point, DePascale includes a substantial discussion of whether the margin of error on the NECAP means that a student could be flunked accidentally, and claims that the chance is less than 1%, for a student barely above the threshold, after repeated testing. It’s not perfectly clear to me what point I made that this is supposed to contradict. On the contrary, this actually strengthens my contention that the test was designed to make sure that the scores were statistically sound, that a student who scores in the 40th percentile belongs there.
To make his third point, DePascale shows the distribution of test scores for the 11th grade reading and math tests, shown below.
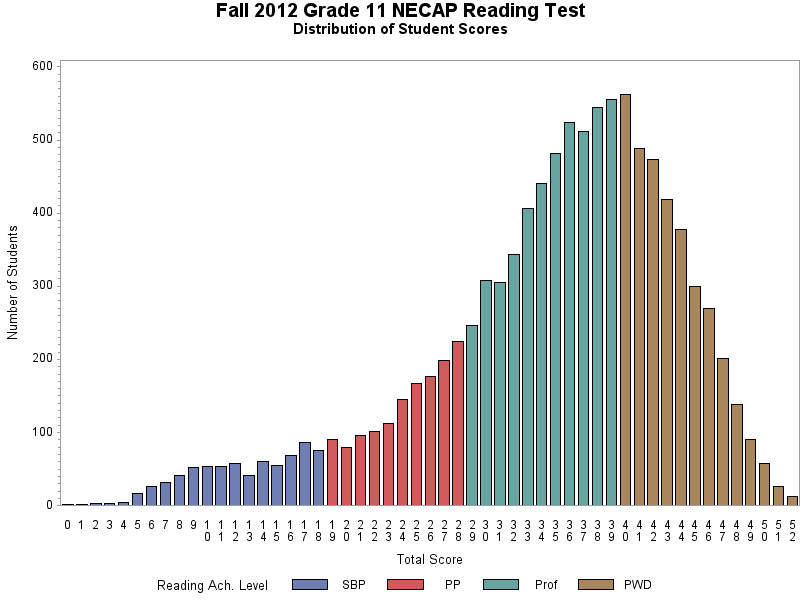 His main goal in showing these graphs seems to be to claim that, since the 11th grade reading test looks reasonably close to the curve you’d expect for a good graduation test, the 11th grade math test is fair. He makes the same point in other parts of the document.
There are few things to say about this curve. It does show a lump of students above the passing grade, and the distribution does appear similar to the results of a test one might design to be a graduation test. However, the fat tail of the reading test distribution is not just a detail, when it comes to judging a test’s suitability as a graduation test. It might not be anything important, but you can’t just assume that. Leave that aside, though, let’s just note that it’s a funny kind of defense of one test to say that another one is just fine. I might accuse you of being a criminal. To have you reply that you have law-abiding friends isn’t much of a defense, is it?
So what is the distribution of scores for the math test? Here it is:
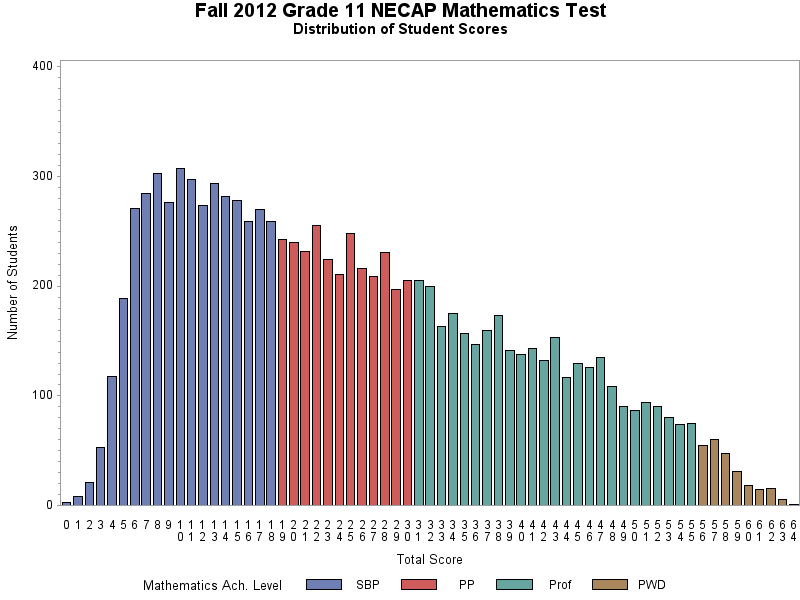
This is a highly skewed result. It’s certainly easy to rank the successful students in this test, since they are spread over the map. But this is a very peculiar distribution for test results that have weight in students’ lives. It’s not at all the distribution you’d expect to see of students, from the big bump at the left to the nearly linear descent as you go to the right.
What’s even more remarkable than the distribution itself is to think that some testing professional — some psychometrician — once looked at that distribution and thought, “Wow, kids really don’t know their math, do they,” and not “Wow, are we sure this test is doing what we think it’s doing?” But if there was ever any such self-doubt, there is no record of it.
And that brings me to the question of validity — how do you know a test is a good one? — and the other psychometrician I met over the weekend. More on that meeting in my next post.
p.s. While you’re waiting for that post, consider throwing a buck to the Providence Student Union. They are the ones who catapulted the issue of the NECAP graduation test onto the state’s front burner with their “take the test” event. Please help me support their great work, click here for details.
]]>