The election of 2012 (Part 9 of MMP RI)

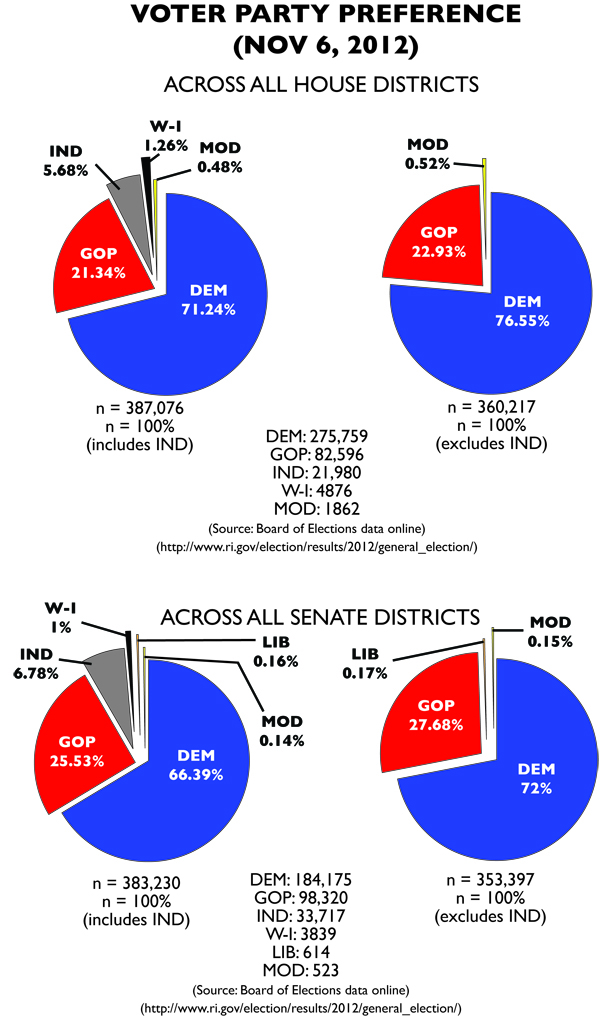
Voter percentages from 2010. DEM = Democratic Party, GOP = Republican Party, IND = Independent, MOD = Moderate Party, W-I = Write-In. (via Samuel G. Howard)
Voter percentages from 2010. DEM = Democratic Party, GOP = Republican Party, IND = Independent, MOD = Moderate Party, LIB = Libertarian Party, W-I = Write-In. (via Samuel G. Howard)

Nationally, Barack Obama was campaigning for a second term. Democrats were convinced they would win, while Republicans were convinced they would win. While Rhode Island was a sure thing, the chance to vote for President increased turnout to historic proportions.

This was bad news for the Republicans and Moderates in the General Assembly. Democratic voters completely overwhelmed their candidates, and many General Assembly candidates never faced opposition in the general election. State Republican Party chairman Mark Zaccaria’s “quality over quantity” strategy was especially foolish in this environment. Republicans actually lost votes from 2010, as many voters were denied the ability to select a Republican for General Assembly at the polls.

The Moderates were unable to hang on to their two seats. Though they finally contested the Senate, they pulled fewer votes than in 2010, and the Democratic tide significantly increased the hurdle to receive seats under the apportionment method. They were less successful than the Green Party had been in 2004, and the Greens lacked the institutional advantage of being a recognized party.

Democrats also avoided a repeat of the Montalbano episode in the House, as Speaker Gordon Fox held off independent challenger Mark Binder. Fox would now preside over a delegation of 109 Democrats, while his Senate counterpart President M. Teresa Paiva Weed would have 55 Democrats. Once again, the Democratic Party had its veto-proof supermajority.

Implications

2012 burst the Republican balloon, especially after conservative media predicted a blowout for Mitt Romney. National Republican obstinacy seems like it may have convinced a large number of Democrats that it’s not a safe thing to stay home. The other thing is that 2012 brought Democratic voters out at levels about what one would expect in a presidential election year. But Republican voters appear at rates just slightly better than 2006; their worst election.

Part of this really is attributable to the lack of competition. As I’ve said before, challenger apathy effects both sides roughly equally, with an advantage going to Senate Democrats. Zaccaria’s strategy of not spending resources on races Republicans can’t win sort of ignores the fact that there’s really little data about what races Republicans can win that they don’t already have a solid lock on. Senate Minority Leader Dennis Algiere regularly racks up around 11,000 votes in his usually uncontested general elections, making him one of the Senate’s highest vote-getters. House swing districts like 71 and 72 (held by right-wingers Dan Gordon and Dan Reilly, respectively) returned lefty Democrats in 2012; in the case of 71, Republicans failed to even put up a challenger.

In an MMP election where the district results are tied to your party’s seat total, failing to run candidates can have a very disastrous effect. A few hundred write-in votes are nothing compared to the huge amount of votes incumbents get. In a purely FPTP system like we have now, it also deprives Republicans of the ability to point out how popular their ideas are statewide. Part of this is because their ideas really aren’t so popular. In this case, it’s actually better for Republican self-image to automatically lose a third of all races and then complain about voters voting for Democrats. In far too many races, voters didn’t have a choice.

RI GA apportioned according to the D'Hondt method. (via Samuel G. Howard)
RI GA apportioned according to the D’Hondt method. (via Samuel G. Howard)


This is Part 9 of the MMP RI series, which posits what Rhode Island’s political landscape would look like if we had switched to a mixed-member proportional representation (MMP) system in 2002. Part 8 (the Election of 2010) is available here. Part 10 is a look at the limitations of this series.

The election of 2002 (Part 4 of MMP RI)

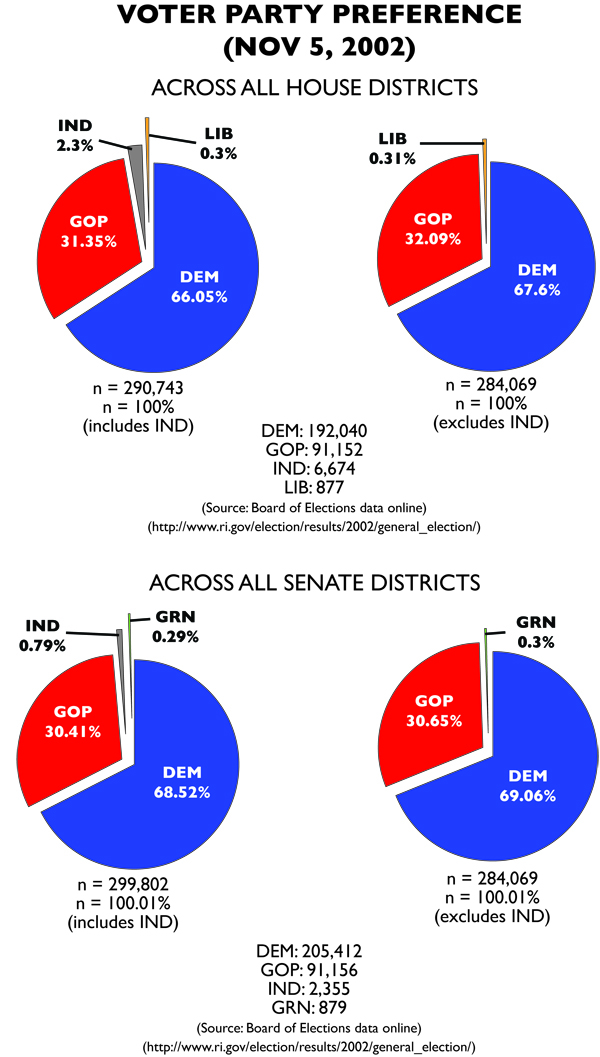
Voter percentages from 2002 (via Samuel G. Howard)
Voter percentages from 2002. DEM = Democratic Party, GOP = Republican Party, IND = Independent, LIB = Libertarian Party, GRN = Green Party. Some percentages add up above 100% due to rounding. (via Samuel G. Howard)

2002 was a momentous year for Rhode Island politics. State Representative David Cicilline announced he would challenge Buddy Cianci for Mayor of Providence. The capital city was also seeing a coalition of left-wing voters working to elect a young Green Party candidate David Segal to the city council. The major battle was between liberal standard-bearer former state Sen. Myrth York and conservative businessman Donald Carcieri.

In this atmosphere of change, so too was the General Assembly changing. Though its number of districts had been downsized, nearly a decade prior voters had approved an expansion of the Assembly; both chambers would practically grow by half.

The results of the election were stunning. Carcieri triumphed over York, who underperformed among Democrats. Cianci was eliminated before election day after being found guilty of racketeering conspiracy; after overcoming a primary election, Cicilline cruised to victory. Segal entered the Providence City Council as the minority leader, the sole member whose party wasn’t “Democrat”.

And in the General Assembly, the change was hard to interpret. Certainly, neither party “lost” seats. And yet, proportionally, the Republicans were stronger than they would have been in the old FPTP system. Instead of controlling a mere 14.67% of the seats in the House, they controlled 32% of the seats. In the Senate, the old way would’ve seen them earn 15.79% of the seats. The new method assigned them 30.26% of the seats.

However, the vast majority of Republican seats were from the party list, not from districts. Failure to contest as many seats meant that their candidates were more beholden to party, rather than to constituency. The Democrats had the opposite issue; their victory in the districts meant that they assigned fewer from the lists. The Democratic delegation would be mostly made up of incumbents, while the new Republicans would be mostly fresh-faced.

The Republicans claimed victory. Here was proof that Rhode Island’s corrupt system had prevented the full choice of the voters from being acknowledged. Democrats, for their part, grumbled, and went home with a slim supermajority of the General Assembly seats.

Implications

In reality, Democrats controlled roughly 85 percent of each chamber. Republicans were essentially shunted aside, even while winning slightly less than a third of the vote. So they controlled half of what they should have in the Assembly proportional to the votes they received.

In retrospect, it seems odd that the impetus for the General Assembly being shrunk was to create greater competition for seats. Mainly, because it failed to work; about a quarter of Senate seats were uncontested (10) as were a third of House seats (34).

RI GA apportioned according to the D'Hondt method
RI GA apportioned according to the D’Hondt method. (via Samuel G. Howard)


This is Part 4 of the MMP RI series, which posits what Rhode Island’s political landscape would look like if we had switched to a mixed-member proportional representation (MMP) system in 2002. Part 3 (an explanation of MMP and an account of the methods used to create these posts) is available here. Part 5 is a look at the Election of 2004.