
The central contention of the real Democratic movement in Rhode Island is probably this: Since the right-wing Democrats rose to power under Bill Murphy in 2003, their bad economic policies have driven our economy into the ground. But one niggling alternate possibly has always bothered me. It’s boring and wonkish. It’s also easily checked by looking at the data. And it turns out it’s wrong.
To understand what I’m talking about, we need a little background into the theory of the 2008 economic crisis that’s become broadly accepted, especially among economists affiliated with the Democratic Party.* (Republican economists have some alternate theories, most of which I find pretty kooky.) The basic story is that 2008 was an old-school private sector debt crisis. Private sector debt had risen much higher than public sector debt. (The exact figure depends a lot on how you count.) Most of the debt had piled up in the business sector, especially the banking sector, but there was still an awful lot of debt in the hands of ordinary American families, mostly in the form of mortgages. It was a lot of debt.
Since World War 2, one of the main drivers of aggregate demand in the economy had been an accelerating accumulation of private sector debt. In the 1908s, as public policy grew more conservative, this debt accumulation began to accelerate even faster, supported by an expanding housing bubble.
Unfortunately, the private sector can’t accumulate infinite amounts of debt forever.
When the housing bubble partially popped, households realized their debt loads were too high, and they began paying them down. Instead of spending that money on consumer goods, they paid down debt. This resulted in a massive crash in aggregate demand and a big economic crisis. To make things worse, the federal government hadn’t been providing enough stimulus to support growth, and the economy had been relying on private sector debt to prop it up. So the recovery was pretty slow as the private sector continued to pay down its debt without much help from the government. Now that the private sector has started going into debt again, we’re seeing growth pick up a bit.
Anyway, this is important because it explains why a lot of states had particularly bad experiences in the crash. States like Nevada and California (and to a lesser extent Florida and Arizona) had abnormally high debt loads, and their residents paid down an abnormally large amount of debt. They wound up with abnormally bad crashes.
The textbook case is Nevada. In Nevada, households reduced debt by the most of any state, with the average resident paying down $26,300 from the end of 2008 to the end of 2013. For comparison, the US average was $6,100. Naturally, Nevada’s crash was especially severe, arguably the worst in the country. Now that Nevada’s household debt load has come down to about the US average, and Nevada residents have stopped paying down debt abnormally fast, the state economy is doing a lot better.
Private sector debt, then, can have a big effect on state economies. So I’d always wondered: could Rhode Island have had an abnormally bad crash not just because of right-wing policies but also because of an abnormally high private sector debt load?
When a recent Boston Fed paper mentioned state-level debt statistics, I wrote to the author, Mary Burke, and she helpfully pointed me to a dataset maintained by the New York Fed. Apparently, the New York Fed has been keeping statistics on state-by-state household debt, with the full data series starting in 2004 (before then, they didn’t track student loan debt). Now, they don’t necessarily count all household debt, but they do count mortgage, auto, credit card, and student loan debt, which together cover the vast majority of household debt.
For the purposes of this piece, I’m going to treat the sum of those four sources as total household debt, which isn’t 100% correct but comes close. There’s one other niggle about this dataset. It only counts state by state statistics in the forth quarter of each year, so when I cite years, I’m not talking about a yearly average. The 2014 forth quarter numbers aren’t out yet, so the latest data come from more than a year ago and don’t really capture the recent return to household debt accumulation.
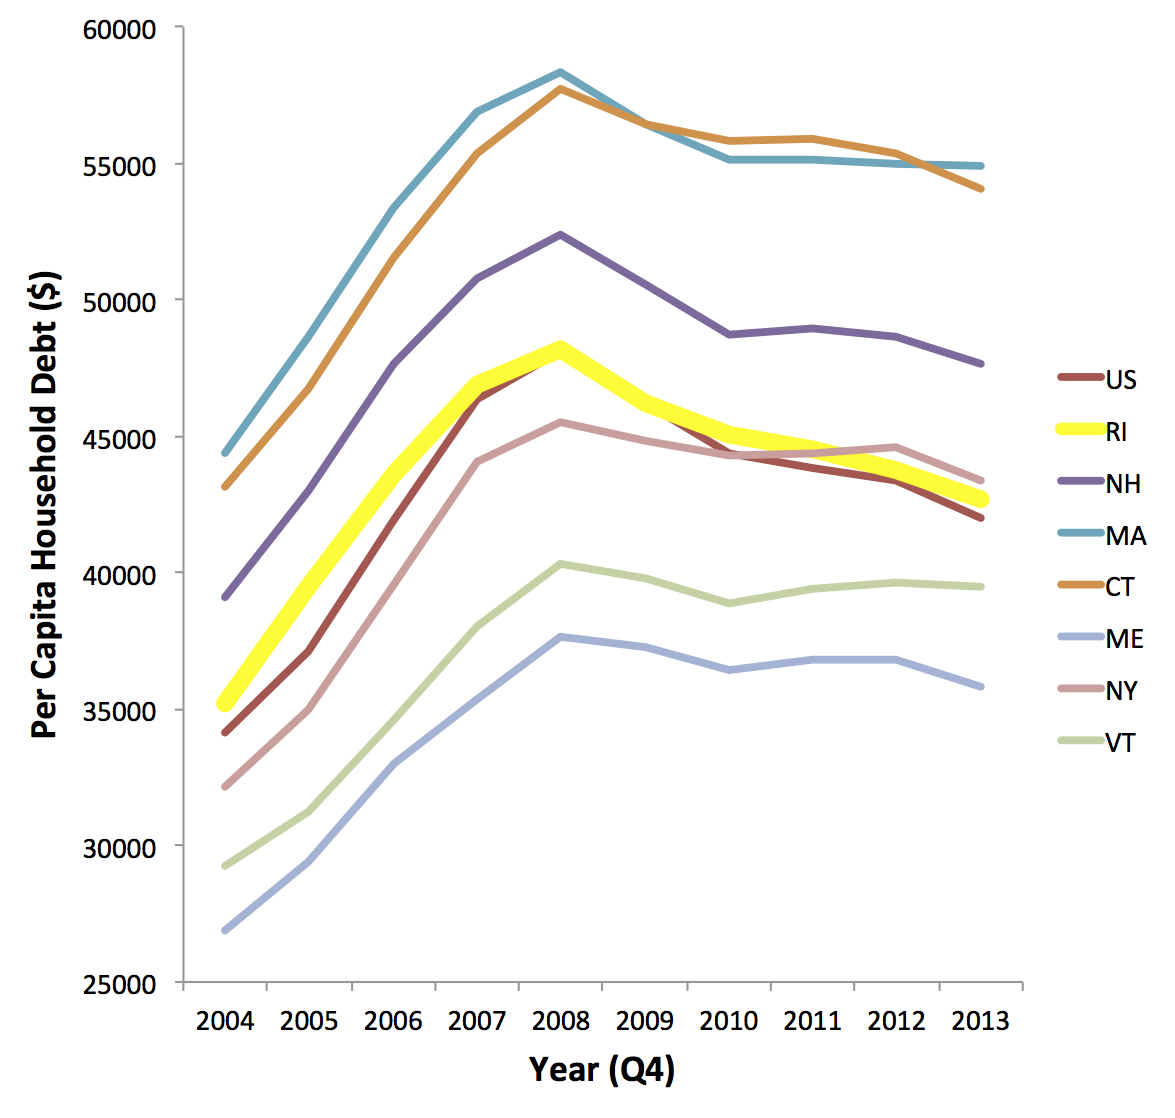 So does Rhode Island have an unusually high debt load? And did we have to pay down an unusually large amount? No and no. In fact, Rhode Island’s peak debt of $48,200 was virtually identical to the national average of 48,100. We reduced debt by only $5,500, which is a little less than the $6,100 national average. So debt cannot explain our abnormally bad crash.
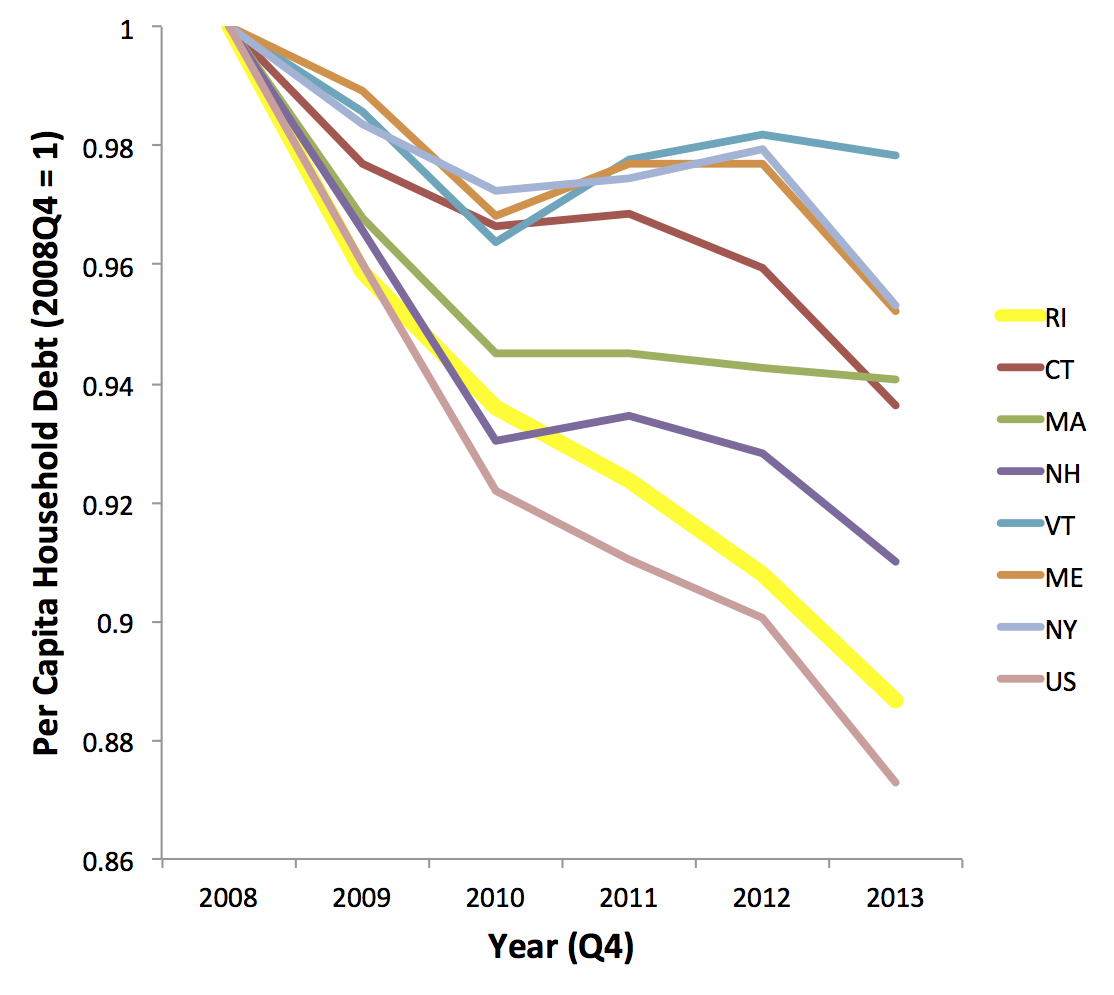
What debt can partially explain is the relatively good performances of our neighboring states. Massachusetts and Connecticut have quite high debt loads, but that at least partially reflects their high per capita income. And relative to the 2008 peak debt, the other states in our region reduced their debt loads a lot less than Rhode Island. This helps explain why our region is doing better than the country as a whole. And it helps explain why we lag behind our neighbors.
But it does not explain why we lag the nation. For that, we really need another explanation. And the right-wing economic policies of the conservative Murphy machine fit the data best.
*The extent to which this theory is fully accepted among Democratic economists is a bit complex. Although it started in a school of thought somewhat to the left of the mainstream, most prominent Democratic macroeconomists have adopted some version of it. The basis of this theory was developed to explain the Great Depression by Hyman Minsky, probably the most important founder of the post-Keynesian school of macroeconomic thought. (Minsky has a bit of a Rhode Island connection. He taught at Brown for a while, and he married a Rhode Islander.) It was later fleshed out by other post-Keynesians, who predicted that the ever increasing private debt would lead to a crash. Broadly speaking, the post-Keynesian movement represents the ideological space to the left of the neo-Keynesians and to the right of the socialists, Marxists, and radicals. Although it’s fully contained within the free market tradition, it tends to generate a lot of scorn from neoclassical economists. Since the crash, however, post-Keynesians have been gaining prominence within the Democratic Party’s policy universe. For instance, prominent post-Keynesian economist Stephanie Kelton was recently appointed the chief Democratic economist for the Senate Budget Committee. Some post-Keynesian ideas remain the subject of fierce debate, but the private sector debt theory of the 2008 collapse has been adopted by more mainstream economists, including Gauti Eggertsson, who is probably the most famous macroeconomist in Rhode Island.