The election of 2010 (Part 8 of MMP RI)


Deprecated: Function get_magic_quotes_gpc() is deprecated in /hermes/bosnacweb08/bosnacweb08bf/b1577/ipg.rifuturecom/RIFutureNew/wp-includes/formatting.php on line 4387

Deprecated: Function get_magic_quotes_gpc() is deprecated in /hermes/bosnacweb08/bosnacweb08bf/b1577/ipg.rifuturecom/RIFutureNew/wp-includes/formatting.php on line 4387
2010 AG Election Results
Voter percentages from 2010. DEM = Democratic Party, GOP = Republican Party, IND = Independent, MOD = Socialist Party. (via Samuel G. Howard)
Voter percentages from 2010. DEM = Democratic Party, GOP = Republican Party, IND = Independent, MOD = Moderate Party, GRN = Green Party. (via Samuel G. Howard)

President Obama’s first term had devolved into the massive bungling of the Affordable Care Act. Republican intransigence in Washington combined with Obama’s refusal to stake out positions for his healthcare reform left Democratic partisans confused and disheartened. Meanwhile, Republicans were rallying against any change, and they had fired themselves up into a new movement, the Tea Party.

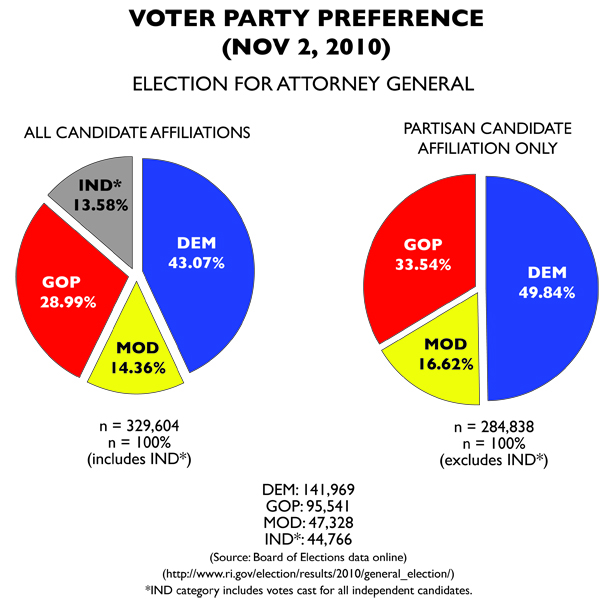
In Rhode Island, the situation was more confused. While the Republicans had nominated outgoing Gov. Carcieri’s senior communications advisor, the Democrats had selected General Treasurer Frank Caprio. Meanwhile, Ken Block was running at the top of the ticket for Rhode Island’s newly minted third party, the Moderates. But the candidate who had the most name recognition was former US Sen. Lincoln Chafee.

Since his defeat in 2006, Chafee had unaffiliated and back Barack Obama’s election in 2008. He would go on to narrowly win the Governorship, after Caprio insulted the President and it made national news. Staunch Democratic voters were left with little choice but to choose Chafee, the man they had rallied to defeat merely four years before.

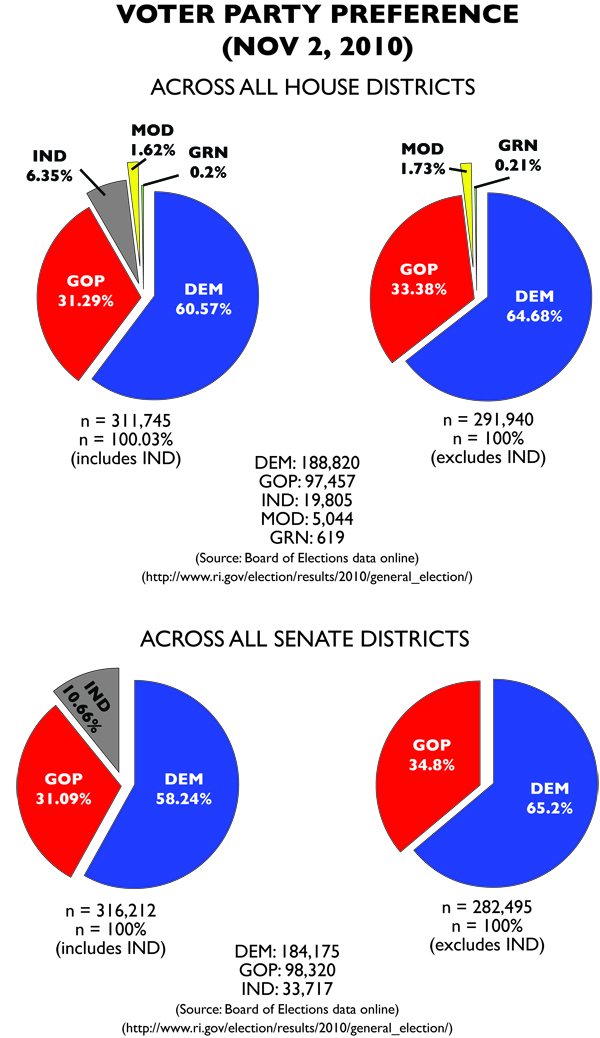
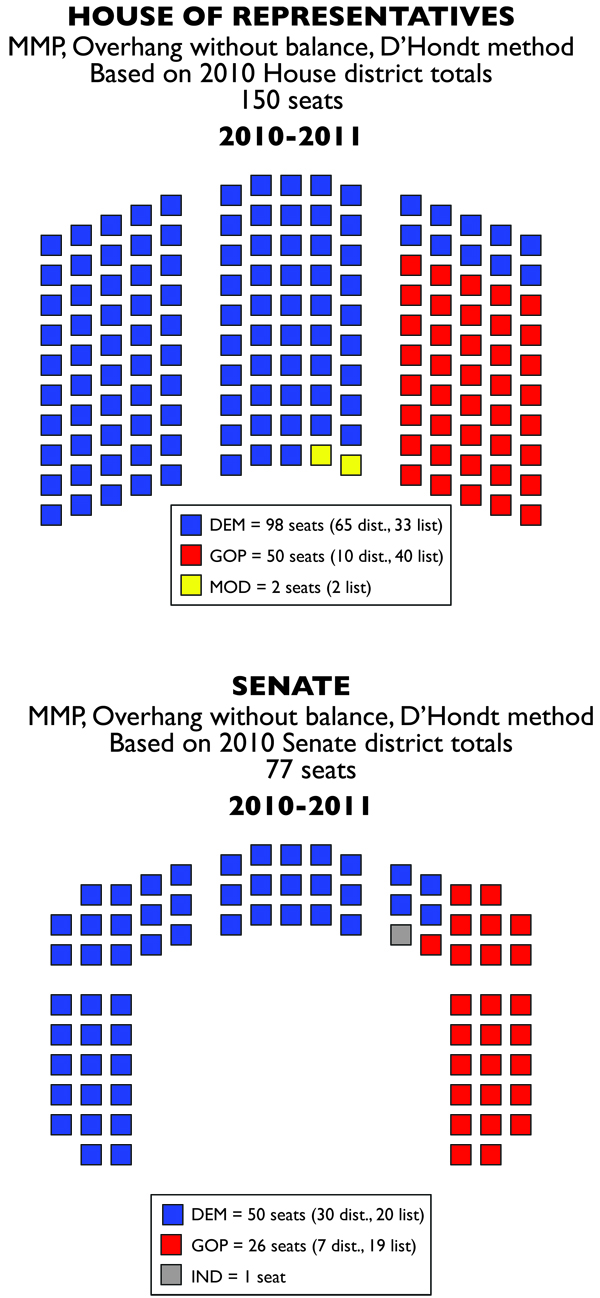
The key issue that would effect apportionment of the General Assembly were the Moderate candidates for the House. While they captured only 1.62% of the vote for House candidates, this meant they had enough to gain two seats in that chamber from their list. For first time possibly since the 1850s, a party other than the Democrats or Republicans had access to the most powerful part of Rhode Island government. Democrats also lost their veto-proof supermajority in both chambers.

Those gains came at the expense of Democrats, who lost 10 seats, with two going to the moderates, and eight going to the Republicans. Republicans managed to gain three seats from the districts as well.

In the Senate, Democrats lost six seats to the Republicans, four of which were from districts. Observers attributed the success to an abundance of general election races in the districts, though noted that much of those contests were due to independent candidates.

Implications

The 2010 election is the most interesting to me (after 1996’s Year of the Cool Moose), and it’s one I’ll return to later, but mainly because it features two statewide races with a third party candidate in it. The other thing is the nature of the Republican gains.

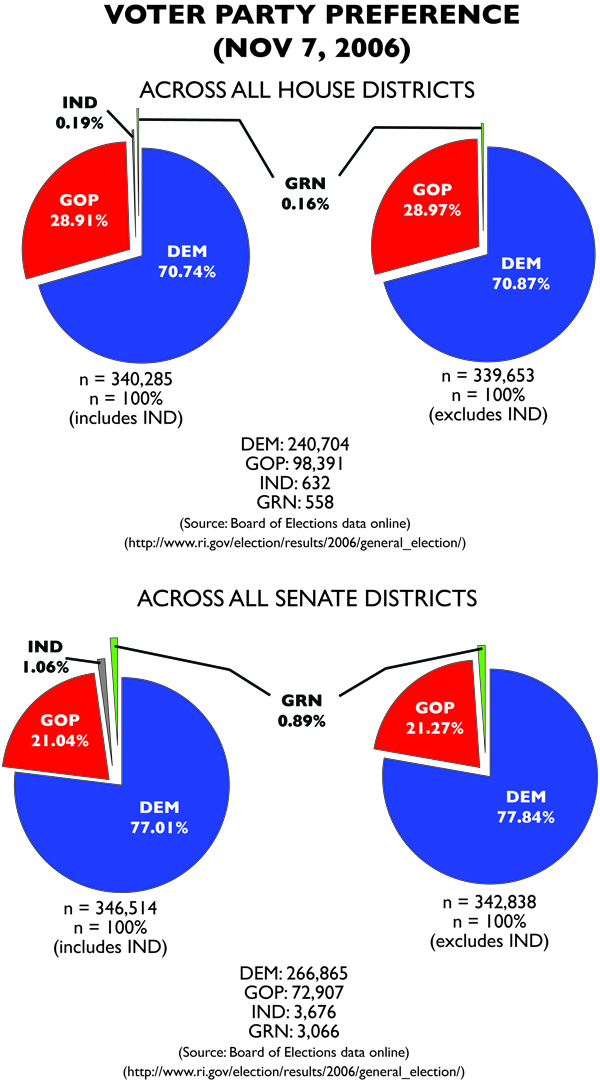
Even in real life, Republicans managed to increase their seats by 100% in the Senate and 50% in the House. The gains are less stunning in MMP, but still significant. And the primary reason wasn’t GOP motivation. Take the 2004 and 2006 elections for Democrats. Democrats won in 2006 (in the MMP version of events) due to a combination of Democratic fervor and Republican apathy.

For Republicans in 2010, their gains were almost completely due to Democratic apathy. While collectively, Republicans shed around 3000-10,000 votes, Democrats collectively lost over 90,000. These missing Democratic voters are what give the Republican Party gains, and why in the MMP version, the Moderates are able to enter the House. The Tea Party is really overblown in RI, because 2010 isn’t an election where the right wing rises up, it’s one where the left wing stays home.

The other thing to consider is that 2010 is the election in which the fewest candidates are without a challenger in the general election. It’s stating the obvious, but it’s impossible to beat an incumbent when no one runs against them.

2010 also lends credence to the idea that the way towards a healthy opposition to the Democratic Party in Rhode Island is not from the right as the Republicans and Moderates are trying, but rather from the left. A coordinated statewide campaign that effectively played on the disappointment many Democratic voters have had with the spinelessness of Democratic politicians could reap unexpectedly large dividends.

Alternatively, if Republicans wanted to win, they actually might benefit from a campaign that preyed on this disappointment to drive down Democratic turnout.

RI GA apportioned according to the D'Hondt method. (via Samuel G. Howard)
RI GA apportioned according to the D’Hondt method. (via Samuel G. Howard)


This is Part 8 of the MMP RI series, which posits what Rhode Island’s political landscape would look like if we had switched to a mixed-member proportional representation (MMP) system in 2002. Part 7 (the Election of 2008) is available here. Part 9 is a look at the Election of 2012.

The election of 2006 (Part 6 of MMP RI)


Deprecated: Function get_magic_quotes_gpc() is deprecated in /hermes/bosnacweb08/bosnacweb08bf/b1577/ipg.rifuturecom/RIFutureNew/wp-includes/formatting.php on line 4387

Deprecated: Function get_magic_quotes_gpc() is deprecated in /hermes/bosnacweb08/bosnacweb08bf/b1577/ipg.rifuturecom/RIFutureNew/wp-includes/formatting.php on line 4387
Voter percentages from 2004. DEM = Democratic Party, GOP = Republican Party, IND = Independent, GRN = Green Party, W-I = Write-In. Some percentages add up above 100% due to rounding. (via Samuel G. Howard)
Voter percentages from 2006. DEM = Democratic Party, GOP = Republican Party, IND = Independent, GRN = Green Party.  (via Samuel G. Howard)

Nationally, the Bush Administration’s bungling of immigration reform and the ongoing failure to end the Iraq War (while the falsification of the cause for war was becoming apparent) had made the Republican Party toxic. At the same time, Howard Dean’s chairmanship of the Democratic Party began institutionalizing data collection for the party via NGP VAN. Democrats were vitalized to throw the Republicans out of power, ending GOP dominance in Washington since the Contract With America.

In Rhode Island, Republicans further weakened incumbent US Senator Lincoln Chafee by primarying him with right-winger Stephen Laffey. When combined with the anti-Republican fervor sweeping the country, he went down against former RI Attorney General Sheldon Whitehouse.

Gov. Donald Carcieri narrowly won reelection over Lt. Gov. Charlie Fogarty, and as usual, the whole slew of general officers below the gubernatorial level were returned as Democrats.

Low Republican turnout meant gains for Democrats in the GA. Close to 50,000 fewer people voted Republican in Senate races than in 2004, while around 30,000 fewer people voted Republican in House races. Combined with a failure to contest district seats, and Democrats saw significant gains. Democrats gained 10 seats in the House and nine seats in the Senate; with Republicans losing the equivalent.

Republicans complained about the master lever costing them votes. Democrats smiled.

Implications

In real life, this was not actually as stunning a shift. In an MMP election, the shifts are 10 seats in the House, 9 in the Senate; all to the Democrats. In reality, Democrats held steady at 33 seats in the Senate, and only gained two seats in the House. What’s even more stunning to me is that while votes for Republican candidates completely collapsed, Democrats actually boosted their turnout over 2004, which defies the common wisdom of “presidential election years favor Democrats because of high turnout.”

Interestingly enough, the vote for independent candidates completely cratered at this point, with House independents only receiving a combined 0.19% of the vote. In 2008, it would soar to the heights it’s achieved in the last three elections.

RI GA apportioned according to the D'Hondt method. (via Samuel G. Howard)
RI GA apportioned according to the D’Hondt method. (via Samuel G. Howard)


This is Part 6 of the MMP RI series, which posits what Rhode Island’s political landscape would look like if we had switched to a mixed-member proportional representation (MMP) system in 2002. Part 5 (the Election of 2004) is available here. Part 7 is a look at the Election of 2008.

The election of 2002 (Part 4 of MMP RI)

Voter percentages from 2002 (via Samuel G. Howard)
Voter percentages from 2002. DEM = Democratic Party, GOP = Republican Party, IND = Independent, LIB = Libertarian Party, GRN = Green Party. Some percentages add up above 100% due to rounding. (via Samuel G. Howard)

2002 was a momentous year for Rhode Island politics. State Representative David Cicilline announced he would challenge Buddy Cianci for Mayor of Providence. The capital city was also seeing a coalition of left-wing voters working to elect a young Green Party candidate David Segal to the city council. The major battle was between liberal standard-bearer former state Sen. Myrth York and conservative businessman Donald Carcieri.

In this atmosphere of change, so too was the General Assembly changing. Though its number of districts had been downsized, nearly a decade prior voters had approved an expansion of the Assembly; both chambers would practically grow by half.

The results of the election were stunning. Carcieri triumphed over York, who underperformed among Democrats. Cianci was eliminated before election day after being found guilty of racketeering conspiracy; after overcoming a primary election, Cicilline cruised to victory. Segal entered the Providence City Council as the minority leader, the sole member whose party wasn’t “Democrat”.

And in the General Assembly, the change was hard to interpret. Certainly, neither party “lost” seats. And yet, proportionally, the Republicans were stronger than they would have been in the old FPTP system. Instead of controlling a mere 14.67% of the seats in the House, they controlled 32% of the seats. In the Senate, the old way would’ve seen them earn 15.79% of the seats. The new method assigned them 30.26% of the seats.

However, the vast majority of Republican seats were from the party list, not from districts. Failure to contest as many seats meant that their candidates were more beholden to party, rather than to constituency. The Democrats had the opposite issue; their victory in the districts meant that they assigned fewer from the lists. The Democratic delegation would be mostly made up of incumbents, while the new Republicans would be mostly fresh-faced.

The Republicans claimed victory. Here was proof that Rhode Island’s corrupt system had prevented the full choice of the voters from being acknowledged. Democrats, for their part, grumbled, and went home with a slim supermajority of the General Assembly seats.

Implications

In reality, Democrats controlled roughly 85 percent of each chamber. Republicans were essentially shunted aside, even while winning slightly less than a third of the vote. So they controlled half of what they should have in the Assembly proportional to the votes they received.

In retrospect, it seems odd that the impetus for the General Assembly being shrunk was to create greater competition for seats. Mainly, because it failed to work; about a quarter of Senate seats were uncontested (10) as were a third of House seats (34).

RI GA apportioned according to the D'Hondt method
RI GA apportioned according to the D’Hondt method. (via Samuel G. Howard)


This is Part 4 of the MMP RI series, which posits what Rhode Island’s political landscape would look like if we had switched to a mixed-member proportional representation (MMP) system in 2002. Part 3 (an explanation of MMP and an account of the methods used to create these posts) is available here. Part 5 is a look at the Election of 2004.