 Brookings Institute‘s new report, “Rhode Island Innovates: A Competitive Strategy for the Ocean State,” was formally presented to Governor Gina Raimondo and other government leaders this morning at the Rhode Island Foundation downtown.
The report can be accessed here.
The executive summary can be read here.
Perhaps the biggest surprise comes early on, when the report declares that Rhode Island’s economy is “less dire than middling.” To hear many people say it, Rhode Island is steps away from economic implosion. The Brookings report is more optimistic.
In the report Brookings offers a package of “initiatives and action steps” … that are “intended as a comprehensive package” of reforms. They see the culmination of these ideas as requiring “a new degree of partnership across the public, private, civic, and philanthropic sectors.”
There’s a lot to digest here in a two hundred page report, but some quick thoughts:
- The word “poverty” occurs three times in the report, and two of those times in exactly the same context: merely noting its existence. In a state with over 14 percent poverty and nearly 1 in 5 children living in poverty, you’d think a report on creating a better economic climate might address the subject more forthrightly.
- Brookings defines “good jobs” as jobs that “offer livable wages with benefits for full-time workers who have less than a four-year degree.” Nowhere in the report is the idea of raising the minimum wage mentioned, yet many of the sectors that Brookings see as having growth potential such as hospitality or shipping create the kind of low paying jobs you might see at a fast food restaurant or a warehouse fulfillment center.
- Taxes: “it is important to keep in mind,” says the report, “that low taxes alone do not spur economic growth.” Yet the report then cites the fact that “Rhode Island ranks 45th in the nation in the Tax Foundation’s 2016 State Business Tax Climate Index.” Yet as economist Peter Fisher ably demonstrates, “Combining more than 115 features of state tax law into a single index number produces a state ranking that turns out to bear very little relationship to what businesses actually pay in one state versus another.” The Brookings Institute’s reliance on the Tax Foundation, which “represents the corporate view of tax policy” calls into question the supposed neutrality of this report.
As I get into the report more and have a chance to hear from others I’m sure I’ll have more to say on this report. In the meantime, I present it here for everyone to get their eyes on the page and contribute to the public discussion.
Here’s the slideshow off the Brookings site:

 I see the Tax Foundation has some issues with disparaging comments I made about their data the other day. Scott Drenkard, one of their analysts, published a kind of defense, but managed to completely miss my point.
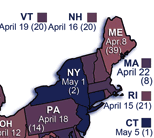
Here’s the story. The Tax Foundation, a DC “think tank”, put out a press release listing “Tax Freedom” dates for all the states. In their telling, you’ve been working for the government since January 1, and you only get to keep the money you earn after Tax Freedom day. In Rhode Island, that was April 15. In Massachusetts, it won’t be until April 22, and so on.
It’s an effective way to illustrate the point, which I suppose is why they do it, but there are some serious problems with their analysis. Topping the list, the state taxes included in their analysis count taxes you pay to other states. Rhode Islanders pay sales taxes in Massachusetts and Connecticut, and gas taxes that wind up in Alaska, and presumably income taxes to whatever states they happen to earn wages in if they work somewhere else. Fine. Maybe this is interesting to someone, but the point of information is to inform. If I want to know whether my state government is making good decisions, how will this help me? It won’t, because whatever decisions my state makes are mixed up with decisions other states have made.
And this isn’t even the end of it. Here’s more:
- The taxes we all pay are dominated by federal taxes. Because that federal tax is still somewhat progressive, the Tax Foundation analysis makes it appear that wealthy states have heavier tax rates than poorer states, just because they collect more money per person. Looking at their data, you might think that Massachusetts is more heavily taxed than Rhode Island, but in truth you can’t learn that from their data because there are multiple reasons why Massachusetts might be higher on the list. Their information has failed to inform about the very question you might consult the list to answer.
- The Tax Foundation data pretends to be for the current tax year, which is silly. The tax year 2012 isn’t even half over, and the most of the relevant data won’t be available until late 2013, at the earliest. Some components of those data will see multiple revisions before 2014. Municipal tax rates for half the year haven’t been set yet. The Tax Foundation is just guessing. Here’s the Center on Budget and Policy Priorities on how they’ve done in the past in this guessing game:
For example, the Tax Foundation’s 2002 report claimed that since 2000, tax burdens had risen in 38 states, fallen in five states, and not changed in seven states. When the Census Bureau released its data for 2002, it found that only four states’ tax burdens had risen, while tax burdens in 43 states had fallen (burdens were unchanged in three states).
In other words, the information is likely wrong, but we won’t know until late next year.
- The Tax Foundation analysis completely overlooks the distribution of taxes. “Taxes” are not one thing, they are many things. Poor people pay more sales and property taxes proportional to their incomes than rich people do. Rich people pay more income taxes proportional to their income than poor people do. Are these among the reasons states differ? The Tax Foundation data can’t say. The same tax rate pulls in far more money in rich towns than in poor ones. Which one is more heavily taxed? The Tax Foundation information can’t tell you.
- Tax Foundation property tax estimates don’t differentiate between areas with lots of vacation homes and those without. Block Island has a tiny tax rate because it has many multi-million dollar homes owned by people who don’t have kids in their schools, and most of whom don’t even live there. Much of the states of Maine (“Vacationland” says their license plates) and New Hampshire are in a similar situation. The tax assessor of Conway, NH told me once that almost half of their property tax bills are sent out of state. Are low taxes there a function of town policy or factors beyond their control? The Tax Foundation statistics can’t say.
An analysis that overlooks all these factors is a waste of pixels that could be better used to portray a kitten. These are numbers whose only legitimate use is to refute their own use. This is not scholarship. It is what Richard Hofstadter called, in his epic 1964 takedown of the intellectual style of the American right wing, the “apparatus of scholarship, even of pedantry.” It might look like scholarship, but the merest peek under the covers gives the game away and you discover vast tables of well-documented but unreliable numbers that don’t tell you what you think they might.
Sadly for our nation, the Tax Foundation has a reputable address and lots of money. They can afford a substantial staff who all wear nice ties in their pictures. (The women don’t, but there are only two of them, a law clerk and the senior fundraiser.) This is enough to garner respect in some quarters, and so their press releases are reproduced in our nation’s newspapers and state and federal legislators talk about their lists. And despite the many ways in which their lists are inadequate guides to policy action, that is precisely the way they are routinely used here in Rhode Island, to our detriment.
Because of the use their numbers get and the respect their address and funding earn, I’ve been checking out Tax Foundation data for almost two decades and have learned something about them. To their credit, they have voluminous footnotes — part of that “apparatus of scholarship” — where they amply document the strangeness of their analysis. What I’ve learned from those footnotes over the years is never to use their numbers. Like the example above, I can always trust their numbers to be right — about the wrong things.
Here’s the point: rankings are simple, but taxes are complicated. If all you know about taxes is where your state falls on a Tax Foundation list, you really don’t know much. Enjoy their lists — I certainly have had great entertainment from them over the years — but for heaven’s sake don’t use them.
]]>“RI tax burden still among highest in U.S.,” reads the headline.
However, if you took the time to read even the first sentence you’d learn that, actually, the Ocean State is somewhere in the middle of the pack nationwide as far as sales tax rates people pay state to state.
“Yet another ranking of the states’ tax burdens puts Rhode Island at the bottom in New England and in the middle of the U.S.,” reports John Kostrzewa.
The study, by 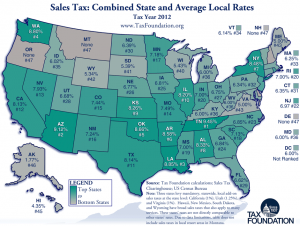 The Tax Foundation, actually ranked Rhode Island 20th in terms of effective sales tax rates that a person would pay in a given state.
While Rhode Island’s state sales tax rate is tied for the second highest in the nation, when local sales taxes are factored in we drop down considerably. It’s an important distinction because it matters little what one jurisdiction or another may charge for a sales tax compared to what the consumer pays in actual retail sales taxes. There are 36 states that have local sales taxes and RI is not one of them.
“A state with a moderate state sales tax rate could actually have a very high combined state-local rate compared to other states,” according to The Tax Foundation’s report.
Kostrzewa makes an interesting point in his article that could actually, if The Tax Foundation factored it in, drop Rhode Island even lower on the list of states with high sales tax burdens.
“There is no mention in the report that Rhode Island’s 7 percent tax is not charged on all items,” he reports, “or that Governor Chafee has proposed that the sales tax be extended to taxicab and limousine rides, car washes, pet grooming and shoes and clothing that costs more than $175 an item. Or that the 8 percent meals and beverage tax be hiked by 2 percent under Chafee’s plan.”
The first clause of his sentence proves Rhode Island’s sales tax burden is actually lower than it may appear in the study (although this may be the case in other states, as well). The second part absolutely doesn’t belong in the study because it is not a part of Rhode Island’s tax system and it’s entirely likely these potential new sales taxes will never become reality. Somewhat similar ideas were cut from the proposed budget last year.
It’s important that Rhode Island discuss its taxing obligations in an honest and fair way, and as a community we aren’t always great at that. We’ve all heard the talking point that people routinely relocate away from Rhode Island because of high taxes and low marks in tax surveys.
On the other hand, just today, as it happens, the Providence Journal also ran a letter from the tax-hating former conservative senate candidate Bob Tingle on why perhaps we shouldn’t worry about those who threaten to flee the state for fiscal reasons. Tingle moved to Florida about a year ago but then decided to move back.
“Rhode Island has its faults, as does everywhere else,” he wrote about his homecoming. “But, Rhode Island is a beautiful and wonderful place. I am proud to be a Rhode Islander and I am extremely happy and grateful that my children grew up here. God Bless our beautiful Ocean State.”
]]>