Legislature Ignores Public Transit in Budget


Deprecated: Function get_magic_quotes_gpc() is deprecated in /hermes/bosnacweb08/bosnacweb08bf/b1577/ipg.rifuturecom/RIFutureNew/wp-includes/formatting.php on line 4387

Deprecated: Function get_magic_quotes_gpc() is deprecated in /hermes/bosnacweb08/bosnacweb08bf/b1577/ipg.rifuturecom/RIFutureNew/wp-includes/formatting.php on line 4387

Who cares about buses? Apparently no one on Smith Hill.

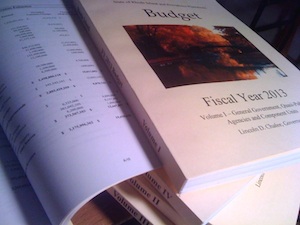
The House Budget, to be voted on Thursday, contains not a penny in new revenue for RIPTA. It also contains no ideas, proposals, or signs that anyone in the House Fiscal staff spent more than a dozen minutes thinking about the agency. This is hardly surprising, since the Governor’s budget didn’t have anything to say about it, either. Despite several years of a funding crisis, RIPTA still struggles to get anyone’s attention.

This, of course, is also hardly surprising. No one in a position of authority actually rides the bus. The Governor doesn’t, the Speaker doesn’t, the Senate President doesn’t, even though the service from Newport to Providence is excellent, with over 60 buses traveling back and forth every day. There aren’t even any members of the RIPTA board who are regular bus riders, besides Anna Liebenow, who has MS and uses a wheelchair. Two current board members have told me they made a point to get on the bus once or twice after their appointment, but that’s not quite the same thing, is it?

This isn’t to say that no one rides the bus. RIPTA provided 26 million rides last year, which works out to serving between twenty and fifty thousand people every day. Over half of them are riding to and from work (like me). Lots of them own cars, which they leave at home to leave more room on the highway and more parking spaces for you.

And, of course, lots of them don’t own cars, or can’t drive, and the bus is their lifeline, the way they get around this state. But who cares about them?  In the halls of the state house, RIPTA is widely viewed as a program for poor people. Consequently it is a poor system, and it’s therefore socially acceptable in that world to ignore it. There are a couple of seats on its board designated for people who represent either poor people or disabled ones, and that’s pretty much that.

The House budget does provide for some capital investment to buy new buses, but that’s not RIPTA’s problem. Their problem is that a big part of their budget comes from the gas tax, and when gas prices rise, more people ride the bus and less gas is sold. Since the gas tax is a set number of pennies per gallon of gas (9.25 cents out of the 32 cent per gallon gas tax), when gas prices rise they get more riders at the same time they get less money. It’s a crazy way to fund the system, but that’s nothing new. Now, despite several years of three-dollar gas and full buses — standing room is not unusual on the lines I ride — there has been zero constructive action to fix the problem.

You should understand a couple more things about RIPTA. One is that compared to other similar sized systems, we get very good return for our dollar from the agency. Comparing rides provided per year to expenses, RIPTA comes out very well in head-to-head matchups with its peers around the country. The other is that to my knowledge, except for a one or maybe two subway lines in Japan, there aren’t any public transit systems anywhere in the world that don’t have a subsidy of some kind. Just as there aren’t any road systems who don’t require a subsidy. Public transit is a matter of public infrastructure and should be supported as such. We’re not talking about a mint.  RIPTA’s deficit is estimated at about $9 million at this point, a little more than one thousandth of the overall budget.

At the current deficit, and with no change at all, RIPTA has approximately half a year left before they can’t make payroll. This won’t happen, of course. What will happen is service cuts that will be devastating for everyone who relies on the bus. Without buses there will be around 10,000 more cars on Rhode Island roads every day, along with many more people than that cut off from jobs they travel to, or just unable to get around because they can’t afford a car — or because they can’t drive.

So come on, tell your Representative or Senator that we need public transit. (And do it today!)  We don’t need more buses without the money to run them. Call Helio Melo, the House Finance chair and tell him that just because he doesn’t ride the bus doesn’t mean that nobody does. Tell Gordon Fox that not everyone can afford a car. Tell Teresa Paiva-Weed that our state will be a cleaner, more pleasant place to live — and drive — with a healthy and well-funded bus system. We need more people on the bus, not fewer, and letting RIPTA choke on gas tax fumes is exactly the wrong direction for our state to be going.

As Legislature Spends Money, Cities Feel Pinch


Deprecated: Function get_magic_quotes_gpc() is deprecated in /hermes/bosnacweb08/bosnacweb08bf/b1577/ipg.rifuturecom/RIFutureNew/wp-includes/formatting.php on line 4387

Deprecated: Function get_magic_quotes_gpc() is deprecated in /hermes/bosnacweb08/bosnacweb08bf/b1577/ipg.rifuturecom/RIFutureNew/wp-includes/formatting.php on line 4387
Woonsocket High School (photo courtesy of Woonsocket School District)

I see from the Providence Journal that the new state-appointed budget commission has decided that the city council and Mayor Fontaine were exactly right to request permission from the state to impose a supplemental tax increase on their citizens.

Last week, after an impassioned speech by Rep. Lisa Baldelli-Hunt, the House rejected Woonsocket’s request.  This week, the state-appointed budget commission asked that the request be reconsidered.

For some reason state legislators seem to get this idea in their heads that though they were elected on promises of fiscal responsibility, and intend to carry through on them, city council members and mayors get elected by promising to spend like drunken sailors.

This is not only bizarre, but entirely backwards.

By almost any measurement you care to make, it’s the state that has been the fiscal problem child over the past couple of decades, not the cities and towns. The difference is that the state has power over the cities and towns: they have more money, and stand uphill in a legal and constitutional sense, too.  But the General Assembly continues to resist the appeals of the duly elected leaders of our cities and towns, feeling that they know better.

This year, Governor Chafee infuriated organized labor by offering several “tools” to municipal officials to help them control pension costs.  I tend to agree with the labor folks here, that the state should stay out of these issues, and that passing state laws to trump local bargaining agreements is only a good idea in a very limited short-term sense.  But the Assembly has shown no interest in believing Mayors when they complain about financial stress, so if you don’t want more bankrupt cities, what should you do?  It seems to me that Chafee wasn’t so much sticking his thumb in Labor’s eye as making a realistic assessment of the Assembly and acting accordingly.

Or maybe not.  It appears that the Assembly leadership isn’t interested in Chafee’s suggestions, and pretty much none of them were put into the House budget.  This reminds me of the time in 2005 when the Carcieri administration came up with some personnel reforms that might have saved around $32 million.  They were the usual sort of benefit cuts, limits on vacation time and sick time and an end to “statutory status” which is a kind of state employee tenure.

Whatever you think about the wisdom of those reforms, it’s hard to praise the Assembly for what happened next.  The legislature rejected the reforms — but left the $32 million in savings in the budget.  So the administration was faced with finding $32 million in savings, but without the law changes to do it.  How, exactly was that responsible?

So now the Assembly is poised to do the exact same thing, and act to increase the pressure on cities and towns — not enough money to support their commitments, but no relief from those commitments, either.  The only difference this year from previous years is that now we have some Assembly appointees joining the Mayors in the hot seat, begging that they not be put in the same position as the Mayor and City Council of Woonsocket.  Mayor Leo Fontaine and the Council have failed to keep Woonsocket solvent, but a new budget commission won’t do any better unless the conditions change.  Right now, the only way the conditions will change is through the bankruptcy court, so mark your calendars.  I simply can’t agree with the people who imagine that dragging each of our cities into bankruptcy is a sensible strategy — in either the long or short term — for our state.

The Assembly can act here.  Sensible options are available, that take into account the actual realities facing our cities.  But will it?  So far, it does not appear likely.

Budgeting for Disaster: Like What We’ve Got? Good


Deprecated: Function get_magic_quotes_gpc() is deprecated in /hermes/bosnacweb08/bosnacweb08bf/b1577/ipg.rifuturecom/RIFutureNew/wp-includes/formatting.php on line 4387

Deprecated: Function get_magic_quotes_gpc() is deprecated in /hermes/bosnacweb08/bosnacweb08bf/b1577/ipg.rifuturecom/RIFutureNew/wp-includes/formatting.php on line 4387

As has been amply reported by other writers here and in other places, the state budget has emerged from the mists of the Finance Committee, and will likely be voted on and passed this week. It contains no broad-based tax changes, though there are small increases in cigarette taxes, and small expansions of the sales tax, and tolls, to cover restoring 40% of the money cut from care to the developmentally disabled, and to fund the state’s education funding formula — the one that the legislature’s own study shows is inadequate. Due to more encouraging revenue projections than were the case last fall, some money has been restored to important places, but it’s just a bit here and there.

This graph is still the policy of the state:

That lower line is the effective tax rate on the median taxpayer. The blue line is the rate on the top 1%, and the red line is just thrown in there to show there is no relationship between taxes and unemployment.

The message overall from the legislature is that the cities and towns be damned. There seems no willingness to acknowledge that the fiscal crisis in the cities is largely the result of state policies. Tremendous cuts in state aid in 2008-2010 to both the municipal and education sides of city and town budgets brought fiscal havoc everywhere, and last week we had the spectacle of Lisa Baldelli-Hunt, a representative from Woonsocket, begging her colleagues in the legislature not to allow Woonsocket to fix the problems caused by her colleagues. Oddly enough, they complied, and now we have two more cities half a step from joining Central Falls in bankruptcy.

The sad fact is that by and large the people in charge of our cities and towns have actually been more fiscally responsible than legislators in the General Assembly, but they have less power, and so the Assembly leadership can pretend otherwise.

That’s quite a claim, isn’t it?  How to back it up?  How about this: as of 1990, Rhode Island cities and towns collected about $1.3 billion, between state aid, property taxes and various municipal fees. In 2008 — before the worst of the state aid cuts — they took in a bit less than $3 billion. This does not count the car tax payments from the state, which only offset taxes that towns would have collected from their residents. If you’re keeping score, that’s growth of about 1.9% per year — after correcting for inflation. This is troubling, but it’s not necessarily evidence of mismanagement. Inflation measures the price of goods and a few services, while towns spend their money on services and a few goods.

So how best to measure this if not against the inflation rate?  If you want a yardstick with which to measure a service-oriented enterprise like a town, how about a private-sector service like Federal Express? Fedex is fiercely competitive, I hear, and non-union, to boot. How did they do?  In 1990, it cost $11 to send an overnight letter across the country, and today it’s about $25.50 for the same service. After correcting for inflation, that’s up about 2% a year.

What about the state?  After accounting for inflation in the same way, the state’s general revenue has gone up 2.4% per year since 1990, and overall expenses are up even more. (That’s the structural deficit and the rise in state debt you’re smelling.)

So who is being more responsible with tax dollars?  The General Assembly, with members like Baldelli-Hunt who give lectures to municipalities, or the towns, who have controlled costs not only better than the state, but better than Fedex. But it’s the towns who get cut while the state basks in the adulation of business leaders who praise legislators for their tax cuts.

The main message of this budget bill is continuity. This is a budget motivated by policy choices virtually identical to the ones of the previous year, the year before that, the year before that, and so on. The idea is to squeak through another year with minimal pain to everyone, especially the wealthy. But it was to a large extent that very set of policies that brought us to the status quo: high unemployment, bankrupt cities, ever-rising tuitions at the state colleges, and lower taxes on rich people.

Do you like the way things are going around here?  Hope you do, because the legislature is voting this week to give you more of the same.

Better Government, or Just Cheaper Government?


Deprecated: Function get_magic_quotes_gpc() is deprecated in /hermes/bosnacweb08/bosnacweb08bf/b1577/ipg.rifuturecom/RIFutureNew/wp-includes/formatting.php on line 4387

Deprecated: Function get_magic_quotes_gpc() is deprecated in /hermes/bosnacweb08/bosnacweb08bf/b1577/ipg.rifuturecom/RIFutureNew/wp-includes/formatting.php on line 4387

One of the great things about sophistry is that in any argument there is always enough dust around to throw in people’s eyes. Whatever the argument, the dirt at your feet is always at hand.

One of the great things about intellectual honesty is that you don’t take positions without multiple sources of support. It helps you see through the dust, too.

A week ago I wrote about how spending under Obama has not been nearly as profligate as is widely thought. Marc Comtois, one of the dedicated soldiers of the right who daily lays waste to armies of straw men over at Anchor Rising, thinks he’s found a nut, and complains that an article I used in support of that essay had been amply refuted. (You can find his links in the comments over there.)

What he doesn’t get is that those refutations are just dust. One can go into the weeds of the refutations to show that they are just as tendentious as the original article they critique, but why bother? Even if you pretend the article I cited was all wet, there is ample other support for the assertion that if you really care about responsible spending, you shouldn’t vote for people who promise cheaper government.

So, for example, if you don’t like Mr. Nutting and marketwatch.com, how about the Center for Budget and Policy Priorities?  Here’s what they say:

“By themselves, in fact, the Bush tax cuts and the wars in Iraq and Afghanistan will account for almost half of the $20 trillion in debt that, under current policies, the nation will owe by 2019. The stimulus law and financial rescues will account for less than 10 percent of the debt at that time. “

Oh, wait. You say CBPP is a partisan organization. Well then how about the Cato Institute?  Its director, the late Bill Niskanen had a reputation for unyielding libertarianism, and also a reputation for intellectual honesty, part of what has made Cato a source of actually useful data over the years. He wrote an article some years ago pointing out that the “Starve the Beast” strategy of cutting taxes to force spending cuts did not work. In short, Republicans made deficits bigger and Democrats made them smaller. (Original article, recent follow-up.)   I wrote a follow-up to Niskanen’s original article pointing out that the situation was even worse than he wrote (page 2 at the link).

In other words, pretty much any way you turn, evidence says that if you care about responsible spending, vote for the people who don’t focus on spending. Vote for the people who are talking about what government should do — they’re the ones who care enough about the enterprise to do it responsibly. And yes, any given article or set of numbers can be showered with dust, obscuring its meaning. But dust is for brushing aside.

Now, all that said, what do I think about this?  In basic economics classes, we’re taught that the Great Depression was ended by demand-side spending — the spending necessary to fight a World War was of the scale necessary to bring our nation out of the economic funk of the 1930s. I believe that 50 years from now, students in basic economics classes will ask impertinent questions of their professors when they wonder why, with that example to go by, the world acted in precisely the opposite way when faced with the challenges of the Bush depression. The fact is that the last three years have seen ample confirmation of the theory behind Keynesian stimulus, but it’s all been in the wrong direction. We’re doing the opposite of stimulus, so we get the opposite of prosperity.

Which is all to say that I’m not defending the Obama austerity. I’m simply stating the fact that if you want responsible spending, the record — stretching over decades — says that voting for people who simply promise to make government cheaper is the wrong way to get it.

Venture Capitalism: Bain of the Stationery Market


Deprecated: Function get_magic_quotes_gpc() is deprecated in /hermes/bosnacweb08/bosnacweb08bf/b1577/ipg.rifuturecom/RIFutureNew/wp-includes/formatting.php on line 4387

Deprecated: Function get_magic_quotes_gpc() is deprecated in /hermes/bosnacweb08/bosnacweb08bf/b1577/ipg.rifuturecom/RIFutureNew/wp-includes/formatting.php on line 4387

Before 1986, did you use office supplies?  Did you buy ribbons for your typewriter, pencils, carbon paper, and blotter paper?  Did you buy floppy disks, plotter pens, and printer paper?  Or did you just find them on the street?

I ask because I keep reading that Mitt Romney created 90,000 jobs by helping Tom Stemberg found Staples, the office supply giant. But it seems that only 90,000 people work at Staples now, so how does that make sense that they created 90,000 jobs?

Maybe I’m not being clear. I very clearly remember the delightful E.L. Freeman, Stationer’s, on Weybosset Street in Providence. I loved the bins of pens, the shelves that went up to the ceiling, and the way the guys who worked there knew pretty much everything I wanted to know about what was available and what it was good for. When I didn’t have time to go all the way downtown, there was a smaller stationer’s on Thayer Street, at the lower end, and another up on Hope.

These places are all gone now, gone the way of the carbon paper they sold, casualties in the price war that Staples won. Staples was a stupendously successful investment for Bain Capital, but it was successful precisely because it upended the status quo of stationery retail. The jobs those little stores provided for the people who ran them and worked in them are also gone with that carbon paper. So shouldn’t the number of jobs Staples “created” be the net, not the gross?  Certainly Staples created jobs for itself, but didn’t it also cause some jobs to be lost?

The Census Bureau has an answer. In 1987, retail and wholesale merchants of stationery and office furniture employed 175,055 people. In 2007, they employed 213,653. So apparently the industry added only 38,598 jobs between Staples being founded and 2007.

And, of course, the nation’s population grew during that time. If we account for that, it appears that we might have about 4,000 more jobs now if Staples had never been invented. And the jobs that remain aren’t as good. Payrolls in these trade sectors ran about $19,700 per employee in 1987. As of 2007, the number is $26,500, about one-third less after correcting for inflation. In other words, Census data implies that the introduction of big-box retail in the stationery sector cost us jobs and made the remaining jobs worse. No wonder Republicans in Congress are attempting to slash the Census Bureau’s budget.

This is, of course, the way our economy works, the “creative destruction” Joseph Schumpeter was so fond of. I liked Freeman’s, but Staples is certainly less expensive. You can think that’s a tragedy for workers or you can think it a boon to consumers. I don’t have to express an opinion about that to know that it’s dishonest to ignore what really happened to the stationery market when I’m counting jobs.

And here’s the real conflict between being successful at business and being successful at government. In business, you’re only responsible for your team, while in government you’re responsible for everyone. Staples doesn’t have to account for the Freeman employees who lost their jobs. To them, 90,000 new jobs is a clear win, and they are free to ignore the losers. But those people who lost their jobs don’t disappear. The accounting for the nation as a whole is a very different thing and has to account for both the winners and losers.

I don’t know about you, but I am mightily tired of hearing people who became rich in business touting their experience as if it’s relevant to running a nation or a state. I don’t want a president or a governor who measures jobs gained and ignores jobs lost. I don’t want someone who focuses on job “creators” and ignores the workers and consumers who make their businesses go. I don’t want someone looking for profit for a small minority of the population, and I don’t want a deal-maker if that excludes the rest of us from consideration. I want a government that sees the whole picture and acts with the greater good in mind.


President Obama and the Imaginary Spending Binge


Deprecated: Function get_magic_quotes_gpc() is deprecated in /hermes/bosnacweb08/bosnacweb08bf/b1577/ipg.rifuturecom/RIFutureNew/wp-includes/formatting.php on line 4387

Deprecated: Function get_magic_quotes_gpc() is deprecated in /hermes/bosnacweb08/bosnacweb08bf/b1577/ipg.rifuturecom/RIFutureNew/wp-includes/formatting.php on line 4387

Recently, I did something I shouldn’t have done, and I’d like to confess here.

Someone I don’t know wrote me a nice note about some things I have written and some banking issues I’m working on (more on this someday). In the process of the note, he described himself as moderate Republican, “fiscally conservative and socially liberal.”  This, it turns out, is one of my buttons because it implies that usually liberals aren’t fiscally conservative.

The idea that liberals are spendthrift is little more than an insult that has stuck over time due to incessant repetition rather than evidence. It wasn’t liberals who brought our nation to the brink of financial ruin in 2008. It wasn’t liberals who doubled Rhode Island’s debt 2003-2009 for no good reason. It wasn’t liberals who created the fiscal crisis that has bankrupted one Rhode Island city and threatens several more. In all of these cases, it was either soi-disant fiscal conservatives or crony insiders who did all of it and I, for one, am completely sick of having to feel apologetic about my policy preferences. Medicaid is a money-saving program, as is welfare, early childhood education programs, environmental protection, and a lot more like those. The fact is that every progressive I’ve ever had a policy conversation with should be described as fiscally conservative, and yet the stereotypes persist, due to lazy reporters and politicians who benefit by perpetuating it.

So I was pleased to notice this article yesterday that pointed out the grim reality.  You know that Obama spending binge you read about, when he came charging into office with a mandate and a Democratic Congress?  Never happened. The article points out that on an annualized basis, spending under Obama is up about 0.4% per year. Of course it’s true that the 2009 fiscal year included Obama’s stimulus package, even though he took office part way through that year, with the budget already passed. But even if you count the stimulus, spending is up 1.4% per year under this president. Compare that to 7.3% per year in Bush’s first term, and 8.1% per year in his second.

The article has a great bar chart comparing the fiscal records of the last few Presidents. Because I think he’s unjustly maligned, I checked out Carter’s numbers, too, and after adjusting for inflation, spending increased less under his administration than under Reagan’s.

Why is the federal deficit such a huge problem?  Because of tax and spending decisions made under George W. Bush. Why are cities and towns in Rhode Island either bankrupt or flirting with it?  Because of spending decisions made under Don Carcieri. Obviously Congress and the General Assembly have had a lot to do with this, too, but it wasn’t liberals in Congress who voted for the Bush tax cuts, the Medicare drug benefit, or even the Iraq War resolution. And it wasn’t liberals who doubled the state’s debt (mostly without voter approval), loaned $75 million to Curt Schilling, and came up with all the different tax cuts for rich people passed over the past 15 years. Some liberal members of the General Assembly cast votes for budgets containing those tax cuts, but that’s the way this Assembly is run, and many have supported floor amendments to the budget to overcome those cuts. (Of course the current Speaker of the House has been known to describe himself as liberal, but the public record hardly supports that, and I notice he’s stopped doing that, at least to the reporters whose work I read.)

Is there spending I support that isn’t getting done?  Of course there is. I support actually doing maintenance on our assets — because it’s cheaper than not doing it. I support health care reform — because it’s cheaper. I support early childhood education — because it’s cheaper. I support a cleaner environment — because it’s cheaper. I support taxing enough so our governments don’t require short-term borrowing — because it’s cheaper. Get the picture?

Obviously this isn’t the only reason to spend money. Helping support the poor and disabled is not necessarily cheaper than letting them die on the streets, but bodies lying about would damage the feng shui of our cities. Government has a role in counter-cyclical spending, to keep the economy moving during a downturn. You actually can make cost-benefit arguments about both of these, but they rest on shakier numbers, so why not just go with the alleviating human suffering angle?  Parks and beaches are cool, historically the arts have never thrived without government patronage, and I wouldn’t try to justify the Smithsonian on cost/benefit grounds, either. But overall the picture of spendthrift liberals is little more than a libel, perpetuated because fulfills some rough conceptual framework, and because some people imagine that being fiscally conservative means you don’t have to pay for stuff.

Which is all to say that I apologize to my correspondent for snapping at him for what was otherwise a perfectly pleasant note.

Forget About Schilling, Stokes; Let’s Rethink EDC


Deprecated: Function get_magic_quotes_gpc() is deprecated in /hermes/bosnacweb08/bosnacweb08bf/b1577/ipg.rifuturecom/RIFutureNew/wp-includes/formatting.php on line 4387

Deprecated: Function get_magic_quotes_gpc() is deprecated in /hermes/bosnacweb08/bosnacweb08bf/b1577/ipg.rifuturecom/RIFutureNew/wp-includes/formatting.php on line 4387

As we think about the potential debacle that 38 Studios represents, it’s worth putting a quarter into the time machine and revisiting some great moments in EDC history.

This is from a 2009 column I wrote about EDC (link – scroll down to “EDC: What’s the point?”).  A report had just come out scolding EDC’s performance, and this was my review of that report.

But what of EDC itself? The panel complained they were without focus, and alternately complained they didn’t spend enough time working with already-existing local companies and that they don’t have a good marketing approach to attract companies from elsewhere. So which one should the refocused EDC take on? Both, says the panel. That will sure improve the focus, won’t it?

Some background you might not remember: Back in the misty dawn of time, EDC was born as the RI Port Authority and tasked with issuing bonds to develop and preserve the Port of Providence. When the Navy pulled out of Quonset, the Authority’s authority expanded there. Then, in 1995, when Governor Almond decided that the state’s economic development apparatus should no longer be a department of the state, he laid off the entire department, and transformed the Port Authority into EDC.

Why the Port Authority? Simple. Almost alone among state agencies the Port Authority had been granted unlimited borrowing authority when it was formed, which EDC inherited. And borrow they have, for good and for, well, less good. They blew $30 million on Alpha-Beta, a bio-tech flop, and EDC’s authority was a pivotal part of the deal that allowed state debt to balloon in order to pay for the I-boondoggle rearrangement of Route 195. There’s plenty more, including $14 million for the Masonic Temple hotel project, and $30 million for the troubled Wyatt jail in Central Falls.

What’s more, freed from the state personnel system, EDC was free to pay its executives whatever they please, and to conduct their business however they pleased. Their executives could wear good suits, house their operation in first-class office space, and generally conduct themselves just like the overpaid CEOs they spend their time with.

This isn’t to say EDC hasn’t done some good. I’ve written approvingly about the geek dinners they promoted under Saul Kaplan, its last director, and there have been other networking initiatives that bore some fruit, too. But let’s be honest. What’s the point of EDC at all? In large part, the best things the state can do for the state’s economy have to do with those essential things that the private sector can’t (or won’t) do: universal public education; maintaining roads, bridges, water lines and the like; policing the marketplace; protecting the environment; facilitating grant-funded research. These are the factors that could make ours a stronger economy. What an EDC can do will only ever be a minor effect compared to these others.

This, of course, is a political problem for the agency because expectations are so much higher than can be achieved.

What happens at an agency with such an ill-defined and difficult role? Failure, that’s what. Over the years, EDC has seen some good people come through its doors (along with the inevitable few who only look good in a suit) but they’ve been tasked with the impossible. Their mission has been to make our state’s economy bloom despite the fact that we are shrinking our investments in our infrastructure, our workforce and our environment. And what have we seen? Tremendous pressure to do something has produced ill-considered loans, and nebulous and occasionally laughable plans.

A future EDC or something like it could play a useful part in monitoring the state’s economy, and in technology transfer, trying to push new technologies into the market to advantage local businesses. They could be useful promoting networking and centralizing some information businesses need. But our EDC has served mostly as an ATM for corporations, and as a state-paid corporate lobbyist, pushing tax cuts in the legislature, oblivious to the effects these cuts have had on permitting delays, to say nothing of education and bridge maintenance. The agency needs to be rethought, but the changes must go a lot farther than this panel envisions.

A correction is in order: the Alpha-Beta deal only cost the state $4.5 million in the end, since the building was resold.  You could argue that the investment worked in that case, since Dow Biopharmaceutical used that space, and has expanded since.  The dozen neighbors we displaced through eminent domain on Dow’s behalf might differ, but the real point is that the occasional winner doesn’t prove that a lottery ticket is a good investment.  There are investments that will produce a return and investments that might.  Which one would you rather bet on?

Equality Endorsement One on Long List for Obama


Deprecated: Function get_magic_quotes_gpc() is deprecated in /hermes/bosnacweb08/bosnacweb08bf/b1577/ipg.rifuturecom/RIFutureNew/wp-includes/formatting.php on line 4387

Deprecated: Function get_magic_quotes_gpc() is deprecated in /hermes/bosnacweb08/bosnacweb08bf/b1577/ipg.rifuturecom/RIFutureNew/wp-includes/formatting.php on line 4387

On Wednesday President Obama remarked that he supports allowing same-sex couples to marry. That’s great, but it is just words. What’s more, the president doesn’t really have much to say on the issue anyway, since (a) marriage is a state-by-state thing, (b) in state votes, same-sex marriage keeps losing, (c) Obama isn’t a Supreme Court justice, nor does he even enjoy a working majority among them.

Words are fine, and can both inform us and lift us up, but they aren’t reliable. I find I learn a lot less from what people say than from what they do. Everyone wants to be the hero of their own story and so words are generally self-serving. There’s nothing unusual about that. That’s why I enjoy reading budgets more than I like going to press conferences. You learn more, and what you learn is more reliable.

This is never so true as when you’re learning something pleasant. The temptation is never to probe, but just to accept, good news. And of course this is exactly when it’s the most important to do exactly that. Self-deception is the most effective kind of deception, isn’t it?

That’s why it was a pleasure to stumble across a list like this, via Balloon Juice, that provides a list of the things that are within the President’s control on sexuality civil rights and that Obama has already acted on. It’s a fairly long list of hate crime legislation passed, military policies repealed, anti-discrimination clauses adopted, spousal benefits provided, visitation rights granted, family and medical leave act provisions extended, openly gay appointees named, and anti-DOMA arguments made.  The content varies, but many represent actual achievements.  Several of those undo damage done by previous Presidents who vocally supported equal rights, but gave us some pretty damaging policies anyway.

The conflict between those who want the prize now and those who are content to be on the right path will always be with us. Important changes take work, work takes time, and in the long run we’re all dead. These are the realities of political change. There is little reason not to harass those in office about important policies. The office holders who disagree with you need to hear that there are dissenters, and those who agree need your support, and often, a push. But on the issue of civil rights, I believe it’s important to see Obama’s statement about marriage equality not as a beginning, nor even as a bone tossed to an important constituency, but as item number 41 on the third list down.  Call it putting your mouth where your money is.

Who Pays for Tax Cuts to the Rich? The Poor


Deprecated: Function get_magic_quotes_gpc() is deprecated in /hermes/bosnacweb08/bosnacweb08bf/b1577/ipg.rifuturecom/RIFutureNew/wp-includes/formatting.php on line 4387

Deprecated: Function get_magic_quotes_gpc() is deprecated in /hermes/bosnacweb08/bosnacweb08bf/b1577/ipg.rifuturecom/RIFutureNew/wp-includes/formatting.php on line 4387

A correspondent tells me that last week there was a meeting over at University Heights where some residents got bad news about their rent. University Heights was built in the 1960s as a mixed development, split about half and half between market rate apartments and subsidized apartments, available to poor people and families. It’s had quite a history since then, including a period in the early 1990s when it was owned by the tenants’ association.

The recession of the early 1990s brought that dream to an end, and Rhode Island Housing became the owner. In 2006, they sold the project to Fairfield Residential, securing a promise that the affordable units (175 of them) would remain below market rent for forty years.

Now there are a couple of things you have to understand about the practice of affordable housing. One is that almost all the housing out there built under the title “affordable” has a term, at the expiration of which it converts to “market rate” housing. The term might be for 20 years, 40 years, or whatever, but after that, the landlord can rent it for whatever they can get. Sometimes the affordability is extracted from the landlord with a promise of rent subsidies. Other times it’s made in exchange for lower acquisition cost, low-rate financing, or some other way to save money on the project. For an older project like University Heights, most of these ways are not possible, since the project was built long ago. This leaves rent subsidies as the only practical option.

Last week, though, RI Housing announced to some distressed tenants that the apartments they live in have to be transferred to another, less generous subsidy program. Essentially the agency cannot afford to keep the subsidies at the level they had been, so in 2014, the rents for 48 of the apartments will rise substantially.

Why can’t RI Housing afford to keep the more generous subsidy?  Well, in the winter of 2008, as Governor Carcieri looked to the end of the year, there was a looming shortfall. Not only was it the second year of the “flat” tax cutting into revenues, but the coming recession’s bite was already being felt in sales tax collections, too. Rather than admit that the state couldn’t afford the tax cuts under the current conditions, the Governor looked around and noticed $26 million on the balance sheet of RI Housing. So he scooped it out of the housing agency and into the general fund, in order to balance the state’s budget that year.

Why was there a deficit in the winter of 2008?  Partly because of the recession, but also because some of the tax cuts for rich people turned out to be too big. The historic tax credit was too popular, and the renovation of the Masonic Temple hotel used them heavily. The tax credit program was ended that year, because so many credits were outstanding. The data can’t tell us exactly how much these cuts cost, but the income tax receipts that year came in $23 million less than predicted. Personal income in the state didn’t begin to fall until months later, so it’s hard to attribute the loss of income tax collections to the faltering economy.

The $26 million lifted from RI Housing was to fill a small part of a budget hole due in no small part to income tax cuts for rich people. But it wasn’t lying in RI Housing’s accounts unused. It was money intended for the purchase of housing, for subsidizing rents, and for the construction of new units. In other words, it was intended for the benefit of poor people, but Governor Carcieri — and the willing General Assembly leadership — redirected it for the benefit of rich ones. Can there be a clearer example of our state’s priorities over the past decades?

Child Health Deficiencies Explain RI Education Gap


Deprecated: Function get_magic_quotes_gpc() is deprecated in /hermes/bosnacweb08/bosnacweb08bf/b1577/ipg.rifuturecom/RIFutureNew/wp-includes/formatting.php on line 4387

Deprecated: Function get_magic_quotes_gpc() is deprecated in /hermes/bosnacweb08/bosnacweb08bf/b1577/ipg.rifuturecom/RIFutureNew/wp-includes/formatting.php on line 4387

It’s often said that Rhode Island doesn’t get good value for its education dollar. The Rhode Island Public Expenditure Council says so every year, and the claim is dutifully repeated on the radio and I’ve heard it at the State House, too.

But is it true?

A while back I was looking at education funding and comparisons between states, and I noticed how thoroughly Rhode Island is outperformed by Massachusetts. Massachusetts, of course, is less urban than our little state, but even when you leave out Cape Cod and the Berkshires, or only look at urban areas, or high-poverty schools, students in Massachusetts schools tend to score higher on the national NAEP tests of academic prowess. (Check it out.)

As far as costs, Massachusetts is slightly below Rhode Island, though not by far. Both states are pretty much in the middle of the pack. Rhode Island has the 24th highest education expenditures per capita (counting public schools, colleges, and libraries) and Massachusetts is 27th, according to RIPEC’s annual compendium of census data. But it is lower and, according to their respective education departments, Massachusetts spent $13,047 per pupil in 2010, and RI spent $15,024.  (These are elementary and secondary education costs, leaving us 8th in the nation and MA 13th.)

So what’s with that? Our higher costs can’t be attributed to unions, since Massachusetts is as unionized as we are, and besides they pay their teachers more, according to the NEA salary survey. So I looked in the results and found… well I found that it’s pretty hard to compare the numbers, since they’re all reported in different categories. I couldn’t help notice that the Massachusetts numbers do not include things like debt service, construction costs, and transportation for non-public students, maybe a quarter or a fifth of the differences in costs.

Fidgeting around with the numbers for a while, you quickly come to a couple of conclusions. First, the differences are more or less along the lines that Massachusetts has fewer teachers per student, but they get more in the way of support services than here, and they appear to spend quite a bit less on administration. Benefit costs might also have something to do with it, but it’s hard to say. Second, it will take an army of accountants to sort the differences out more precisely than that because the categories just do not line up in a way that makes it easy to compare our state with theirs.

The real reason I was even bothering with this is something else entirely. The Kids Count data book came out in April, and I’ve been meaning to write about it since. Let me say before I go on that I will likely be the last writer in America frantically waving the flag of liberal education as the grim waves of business needs wash over my vessel and draw me down to the darkling deep. To me, there is an inestimable value to teaching our children to appreciate the glories of human civilization. After all, that’s how we pass it on, isn’t it?

But stick with me for a moment, and let’s pretend to look at our schools as little factories to manufacture workers while we consider the, ah, raw materials — and how we care for them. And here’s the funny thing. On pretty much every variable of childhood health and well-being, Massachusetts children have a better time of it than ours do.

Lack of health insurance coverage? 3% vs. 6%. Children in poverty? 14% vs. 19%. Infant mortality? 5.1% vs. 5.9%. Immunized two-year-olds? 80.4% vs. 76.7% This is not just a story about our poverty rate or unemployment rate being higher than theirs. Eligible kids who get food stamps? 68% vs. 75%. Children under the poverty line without health insurance? 6% vs. 11%.

Overall, Kids Count calls Massachusetts the third healthiest state to be a kid in, and Rhode Island lags at 17th. Is it conceivable that this has no bearing on the collective school performance of our children?

Of course, what has our actual record been?  Over the last few years, we’ve tightened eligibility rules and raised co-pays for Medicaid, reduced rental subsidies, ended or severely curtailed child care for poor families, and more.  We prioritize the health of rich taxpayers over the health of poor children, and then complain when the poor children don’t do well on standardized tests.  Go figure.

I’m not counseling only doom and gloom here. In fact, our standing in the Kids Count comparisons has made some desultory progress in the last couple of years.  Despite the funding setbacks, some measures are still improving over where we were a couple of decades ago, just much more slowly and unevenly than we could.  When we’re talking about relative performance of one educational system to another, it’s worth considering the factors outside of the classroom.  Spending a bit more time worrying about the health of our children might be as productive as complaining about the cost of our schools.

Update: I edited to make the distinction between education costs clear.

Budgeting for Disaster: How Budgets Are Cut


Deprecated: Function get_magic_quotes_gpc() is deprecated in /hermes/bosnacweb08/bosnacweb08bf/b1577/ipg.rifuturecom/RIFutureNew/wp-includes/formatting.php on line 4387

Deprecated: Function get_magic_quotes_gpc() is deprecated in /hermes/bosnacweb08/bosnacweb08bf/b1577/ipg.rifuturecom/RIFutureNew/wp-includes/formatting.php on line 4387
FY2013 budget

FY2013 budgetI was at the hearing at House Finance last night, talking about tax cuts for rich people.  The remarkable thing about all the tax cuts we’ve given over the past 16 years is not that we’ve given them, but how we’ve paid for them.

As we saw in the last installment, the story of the past 16 years has been relentless cuts in state income taxes on the top 1% of taxpayers. The cuts have come in several different forms, but the result has been the same: dramatically lower taxes on the top end, much smaller changes for everyone else.

That’s bad enough, but the real tragedy of the tax cutting of the past 16 years is that not a single one of the tax cuts passed by the General Assembly was paid for. The income tax cut of 1997, the car tax cut of the same year, the capital gains tax cut of 2001, and the flat tax cut of 2006 were all “phased in” to avoid having to make the tough decisions people are always talking about.

But the reduced state revenue had to be made up somehow. How did we do it? Over that time, we haven’t cut any major programs. So does this mean that government was too fat? Do we owe a debt of gratitude to the Almond and Carcieri administrations for finally starving the beast down to an affordable size? I’d like to share with you my observations of the five different ways to cut a budget, only the first of which has any claim to being a hard choice:

  1. Terminate a program or benefit.
  2. Supply a program or benefit in a more efficient fashion.
  3. Supply a program or benefit in a shoddier fashion.
  4. Borrow to hide the shortfall.
  5. Foist the cost onto somebody with another source of income.

In my review of state budget cuts over the past decade, I find very few examples of the first method, though there are some. Certainly the Medicaid program is somewhat less generous than it was a decade ago. We cut services for legal immigrant children and pregnant women, for example.  But how many other examples are there? I don’t support Governor Chafee’s proposal to terminate funding of WSBE television, but I applaud him for having the temerity to actually propose ending a fairly popular program.

For the second method, there are a few good examples. The recent reorganization at DMV might qualify. Though it also required some new personnel, they are now providing better service with not too many more people. DOT’s proposal to get designs and buildings from the same contractor has promise in this regard, and the construction of the new train station in Wickford seems to have turned out well.

Unfortunately, too many of these border on examples of the third category: just doing a shoddier job. The General Assembly has, over the years, been not at all deferential to the judgment of department heads and experts about what is actually possible within the budget constraints presented, with disaster or shoddy service frequently resulting.  The transfer of 17-year-olds from the Training School to the ACI a few years ago is an example, and last year’s cut to BHDDH funding is another. A couple of years ago, delays in food stamp processing were so great that the state lost a class-action suit on the issue.

The Department of Transportation’s shameful neglect of maintenance is still another example. Seventeen homes and four businesses in Tiverton are gone today because DOT didn’t maintain the Sakonnet Bridge adequately and they were in the way of the replacement bridge. Nor are they alone in their neglect of maintenance, as any visit to a state facility will attest. A few years ago, URI estimated the cost of deferred maintenance on their campus to be over $400 million, not so much less than a year’s budget.

Category four is excessive borrowing, and DOT has been a prime offender in the category, and so have the colleges, creating fancy new buildings while cutting back on the staff and projects that should be filling them.  Governor Chafee has proposed cutting back the DOT borrowing.

It’s probably the fifth category that has seen the most exercise. In the drive to cut taxes on rich people, the state has cut funding to: municipal governments and school departments who have to make it up with property taxes; to colleges who have to make it up with tuitions; to Medicaid recipients who have to make it up with co-pays; to everyone who fishes, drives, or runs a hospital who have to make it up with increased license fees, and to many more. We’ve even taken it from prisoners, for heaven’s sake, with parole fees, home confinement fees and medical co-pays. Property tax payers, students, poor people, and prisoners have paid for the tax cuts of the last 16 years.

One important point about these categories, is that numbers three and four are only the illusion of cutting costs, and generally make things more expensive in the long run.  And number five doesn’t cut costs at all, either.  If you want an explanation of why government in Rhode Island is expensive, look here.

Let’s be clear: courage is not foisting costs off onto others, nor is it insisting the state do its job badly. It is not borrowing to hide shortfalls or pushing costs into the next year. Calling for efficiency is laudable, but it is not courage, either. (Nor should it be confused with actually finding efficiencies.)

Courage means honesty. It means assessing with honesty our past policies, and not hiding behind some claim that we have to wait and see the effect of tax cuts we’ve been waiting for over a decade to see. It means honestly assessing claims that rose petals will fall from the sky if only we can avoid asking rich people to pay their fair share. It means honestly assessing what our state needs to do and finding a fair way to raise all the revenue with which to do it. Honesty is hard, the reason it’s equivalent to courage.

So listen skeptically when you hear someone — a member of the legislature, an anti-tax activist, or a friend — talking about making those tough choices. Are they talking about categories two through five? Those aren’t tough, so don’t let them hide there.

Budgeting for Disaster: Taxing History


Deprecated: Function get_magic_quotes_gpc() is deprecated in /hermes/bosnacweb08/bosnacweb08bf/b1577/ipg.rifuturecom/RIFutureNew/wp-includes/formatting.php on line 4387

Deprecated: Function get_magic_quotes_gpc() is deprecated in /hermes/bosnacweb08/bosnacweb08bf/b1577/ipg.rifuturecom/RIFutureNew/wp-includes/formatting.php on line 4387

Is it really too soon to modify our tax code?

In the discussions of taxes at the State House, one line you hear a lot this year is that our state’s new income tax code is new and we should give it time to see how it works out.  That’s what House Speaker Gordon Fox has said, and I’m hearing that it’s the line of the day on Smith Hill, available from any of the House or Senate leadership.

This is, of course, a silly point to make.  The tax changes made last year basically just baked in the low taxes on rich people offered by the “flat tax” alternative.  It used to be that a rich person could choose whether to pay tax under the tax code everyone else uses or using the flat tax limit, and now the flat tax limit is part of the code everyone else uses.  This part may be new, but the overall “strategy” at issue — lower taxes on rich people, expect economy to get better — has been the order of the day in Rhode Island for a long time.  To illustrate what’s really been going on in Rhode Island tax policy, I put together the following graph.

The blue line is the effective RI income tax rate on a fairly typical taxpayer in the top 1% over the last 16 years, with the various cuts that taxpayer has received indicated.  These cuts don’t count tax credits like the film production or historic structures credits, which are typically only available to high-income individuals and which make the effective rate even lower.  The black line indicates the effective tax rate on the median taxpayer (the 50th percentile).  You can see a slight decline in the 1997-2002 period, but the other changes didn’t do much of anything for them.

The unemployment rate, of course, has nothing to do with the tax rate, except as a rhetorical club used to beat people about the head and neck.  There is no evidence that it has any causal relationship with the state tax rate (in either direction), but the relationship between taxes and “job creators” is commonly invoked to persuade lawmakers to support lower taxes.   I’ve included the unemployment rate on the graph as a service, so you can see how little is has to do with the movement of taxes.

One more thing you should know about this graph.  There is some evidence available that the 2012 tax changes raised taxes substantially on the middle percentiles of taxpayers.  Unfortunately, it’s premature to say more than that, since the data won’t be available until later this year, at the earliest.

The House Finance Committee is holding a hearing on several bills designed to raise taxes on the top 1% Tuesday afternoon at 4:30pm in State House room 35.  Rep. Maria Cimini (D-Providence) is the prime sponsor (with 36 co-sponsors) of a bill to raise the taxes on people earning more than $250,000 per year by four percentage points, with that top rate coming down as the unemployment rate also goes down.  Think of it as a “pay for performance” clause for rich people.  There are also bills by Rep. Larry Valencia (D-Charlestown, Exeter, Richmond) and Scott Guthrie (D-Coventry) that will have more or less the same effect, though the income limits and tax changes are slightly different (neither of those bills have the unemployment clause).

The Tax Foundation Can’t Help Themselves


Deprecated: Function get_magic_quotes_gpc() is deprecated in /hermes/bosnacweb08/bosnacweb08bf/b1577/ipg.rifuturecom/RIFutureNew/wp-includes/formatting.php on line 4387

Deprecated: Function get_magic_quotes_gpc() is deprecated in /hermes/bosnacweb08/bosnacweb08bf/b1577/ipg.rifuturecom/RIFutureNew/wp-includes/formatting.php on line 4387

I see the Tax Foundation has some issues with disparaging comments I made about their data the other day. Scott Drenkard, one of their analysts, published a kind of defense, but managed to completely miss my point.

Here’s the story. The Tax Foundation, a DC “think tank”, put out a press release listing “Tax Freedom” dates for all the states. In their telling, you’ve been working for the government since January 1, and you only get to keep the money you earn after Tax Freedom day. In Rhode Island, that was April 15. In Massachusetts, it won’t be until April 22, and so on.

It’s an effective way to illustrate the point, which I suppose is why they do it, but there are some serious problems with their analysis. Topping the list, the state taxes included in their analysis count taxes you pay to other states. Rhode Islanders pay sales taxes in Massachusetts and Connecticut, and gas taxes that wind up in Alaska, and presumably income taxes to whatever states they happen to earn wages in if they work somewhere else. Fine. Maybe this is interesting to someone, but the point of information is to inform. If I want to know whether my state government is making good decisions, how will this help me?  It won’t, because whatever decisions my state makes are mixed up with decisions other states have made.

And this isn’t even the end of it. Here’s more:

  1. The taxes we all pay are dominated by federal taxes. Because that federal tax is still somewhat progressive, the Tax Foundation analysis makes it appear that wealthy states have heavier tax rates than poorer states, just because they collect more money per person. Looking at their data, you might think that Massachusetts is more heavily taxed than Rhode Island, but in truth you can’t learn that from their data because there are multiple reasons why Massachusetts might be higher on the list. Their information has failed to inform about the very question you might consult the list to answer.
  2. The Tax Foundation data pretends to be for the current tax year, which is silly. The tax year 2012 isn’t even half over, and the most of the relevant data won’t be available until late 2013, at the earliest. Some components of those data will see multiple revisions before 2014. Municipal tax rates for half the year haven’t been set yet. The Tax Foundation is just guessing. Here’s the Center on Budget and Policy Priorities on how they’ve done in the past in this guessing game:

    For example, the Tax Foundation’s 2002 report claimed that since  2000, tax burdens had risen in 38 states, fallen in five states, and  not changed in seven states. When the Census Bureau released its  data for 2002, it found that only four states’ tax burdens had risen,  while tax burdens in 43 states had fallen (burdens were unchanged in  three states).

    In other words, the information is likely wrong, but we won’t know until late next year.

  3. The Tax Foundation analysis completely overlooks the distribution of taxes. “Taxes” are not one thing, they are many things. Poor people pay more sales and property taxes proportional to their incomes than rich people do. Rich people pay more income taxes proportional to their income than poor people do. Are these among the reasons states differ?  The Tax Foundation data can’t say. The same tax rate pulls in far more money in rich towns than in poor ones. Which one is more heavily taxed? The Tax Foundation information can’t tell you.
  4. Tax Foundation property tax estimates don’t differentiate between areas with lots of vacation homes and those without. Block Island has a tiny tax rate because it has many multi-million dollar homes owned by people who don’t have kids in their schools, and most of whom don’t even live there. Much of the states of Maine (“Vacationland” says their license plates) and New Hampshire are in a similar situation. The tax assessor of Conway, NH told me once that almost half of their property tax bills are sent out of state. Are low taxes there a function of town policy or factors beyond their control?  The Tax Foundation statistics can’t say.

An analysis that overlooks all these factors is a waste of pixels that could be better used to portray a kitten. These are numbers whose only legitimate use is to refute their own use. This is not scholarship. It is what Richard Hofstadter called, in his epic 1964 takedown of the intellectual style of the American right wing, the “apparatus of scholarship, even of pedantry.” It might look like scholarship, but the merest peek under the covers gives the game away and you discover vast tables of well-documented but unreliable numbers that don’t tell you what you think they might.

Sadly for our nation, the Tax Foundation has a reputable address and lots of money. They can afford a substantial staff who all wear nice ties in their pictures. (The women don’t, but there are only two of them, a law clerk and the senior fundraiser.)  This is enough to garner respect in some quarters, and so their press releases are reproduced in our nation’s newspapers and state and federal legislators talk about their lists. And despite the many ways in which their lists are inadequate guides to policy action, that is precisely the way they are routinely used here in Rhode Island, to our detriment.

Because of the use their numbers get and the respect their address and funding earn, I’ve been checking out Tax Foundation data for almost two decades and have learned something about them. To their credit, they have voluminous footnotes — part of that “apparatus of scholarship” — where they amply document the strangeness of their analysis. What I’ve learned from those footnotes over the years is never to use their numbers. Like the example above, I can always trust their numbers to be right — about the wrong things.

Here’s the point: rankings are simple, but taxes are complicated. If all you know about taxes is where your state falls on a Tax Foundation list, you really don’t know much. Enjoy their lists — I certainly have had great entertainment from them over the years — but for heaven’s sake don’t use them.

Celebrate Rhode Island’s Taxes


Deprecated: Function get_magic_quotes_gpc() is deprecated in /hermes/bosnacweb08/bosnacweb08bf/b1577/ipg.rifuturecom/RIFutureNew/wp-includes/formatting.php on line 4387

Deprecated: Function get_magic_quotes_gpc() is deprecated in /hermes/bosnacweb08/bosnacweb08bf/b1577/ipg.rifuturecom/RIFutureNew/wp-includes/formatting.php on line 4387

Did you know you live in a low-tax state?  According to the Tax Foundation, average taxes per person in Rhode Island are lower than in any other northeast state besides Maine, and lower than Utah, Nevada, Wyoming, Delaware, and Virginia.

Each year, you see, the tribunes of wealth and privilege who run the Tax Foundation calculate the date of “Tax Freedom Day” to make a point about how much our nation pays in taxes. The idea is that your pay from January 1 until tax freedom day goes to federal, state, and local taxes and the rest of the year is for you. It’s a perfect expression of our national tax allergy, since TF day comes without a trace of a mention of what we get for that money. Nope, the Tax Foundation is all about the price of government, not about its value.

But put that kind of scoffing aside, what do they show?  According to their calculations, TF day comes on April 15 in Rhode Island, compared to April 22 in Massachusetts, May 1 in New York, April 11 in Texas, April 23 in Wyoming, April 17 in Utah, April 17 in Delaware, and April 18 in Nevada. The only state north and east of West Virginia that has an earlier TF day is Maine (April 8). Hooray for low taxes!

Of course my experience with the Tax Foundation says that you can trust their numbers, but it always pays to read the footnotes so you know what those numbers actually are because they are seldom what you think. In the footnotes and cross-references, you learn, for example, that their calculations of state taxes usually include the state taxes you pay to other states. No joke.  For example, some small fraction of the gas you buy comes (or could come) from Alaska, some small fraction of every dollar you spend on gasoline winds up funding the State of Alaska Permanent Fund. And people from Rhode Island often pay sales taxes to Massachusetts or Connecticut when they shop there, so that counts, too.

This gets to the heart of my complaint about the Tax Foundation. When I’m looking at economic or tax data I don’t just want information. I want information relevant to the decisions before us. The Tax Foundation specializes in information that isn’t relevant to any particular decision. Why do I care how much of my money goes to other states when I’m discussing tax policy in Rhode Island?  And why do I care about average taxes paid per person when I know very well that there aren’t any average people?  The taxes we pay vary according to your wealth and according to where you live. Over the past 20 years, we’ve shifted the load from people who have money and live in the suburbs to people who don’t have much money and who live in cities. To think that some kind of overall average can capture that dynamic is absurd and makes this kind of comparison with other states not just meaningless, but counter-productive.

What is useful about this kind of report is that it puts the lie to claims that there’s anything especially egregious about the level of Rhode Island taxes. We don’t live in a “tax hell,” more highly taxed than other states. We live in a place where inadequate understanding of the economics of taxation has led our leaders to make some really bad decisions about who can afford what, and the result is perpetual cuts in taxes on rich people and increases in taxes on less rich people. That’s all.


As an aside, there’s also an interesting chart on the tax freedom page (look for the heading that says “Historical Tax Freedom Day”). It shows movements in taxes versus movements in the deficit, and you can see from it that before 1980 the two tended to move in sync and since then they’ve moved in anti-sync.  I wrote about a chart very much like that in 2006, when the late director of the Cato Institute, William Niskanen, wrote an article to say that low taxes do not lead to a decrease in the size of government and that real conservatives should stop pretending that they do. Find that article here.


The Tax Foundation had some comments to make about this article, and I responded to them.  Find a link to the Tax Foundation’s comment and my response here.

Fixing the U.S. Post Office, and Fixing It Good


Deprecated: Function get_magic_quotes_gpc() is deprecated in /hermes/bosnacweb08/bosnacweb08bf/b1577/ipg.rifuturecom/RIFutureNew/wp-includes/formatting.php on line 4387

Deprecated: Function get_magic_quotes_gpc() is deprecated in /hermes/bosnacweb08/bosnacweb08bf/b1577/ipg.rifuturecom/RIFutureNew/wp-includes/formatting.php on line 4387
NALC members protesting S1789
NALC members protesting S1789 (credit: Ron Augustus)

Headed down Route 2 yesterday and what did I see?  About a hundred men and women in US Postal Service uniforms, demonstrating outside Senator Jack Reed’s office. What’s up?  They are members of the National Association of Letter Carriers, protesting Senate Bill 1789, a plan to “fix” the post office.

As you may have heard, the Post Office is going broke. It is routinely facing multi-billion-dollar shortfalls. What you may not have heard is why it’s going broke. Actually that’s not quite right. If you’ve been paying attention, you’ve undoubtedly heard accounts of how email is breaking the world of paper mail. While there’s a nugget of truth in this, the real facts show that the real story is that it’s mostly bad accounting pulling the Post Office down.

First some facts: the USPS gets no tax money, except a tiny bit used to pay the postage to send audio books to blind people. The rest of its budget is made through sales of postage and other business income. But despite insisting that the Postal Service be run like a business, Congress has put strict limits on what it must and must not do.

Among the limits are a 2006 law that forces the Postal Service to put away far more money to pay for retirements than is necessary. The USPS retirement funds are currently overfunded by about $13 billion. What’s more, the law demands that by 2016 the USPS have enough money socked away to pay retiree health benefits for 75 years. Yes, that’s correct: the Postal Service is going broke today in order to pay medical benefits for retirees who are not yet born. In the last quarter of 2011, the Service spent $3.2 billion more than it took in. This crazy savings plan for retiree health benefits alone cost $3.6 billion. By itself this expense made the difference between profitability and loss.  For the nine months ending last June, the service lost $5.5 billion and $5.9 billion was for retiree health care. (They report everything by quarters.)  Without that expense, the USPS would have made money for the entire year 2011 — the year its cash flow problems became a crisis. For the record, the retiree health care fund now holds $42.5 billion, and is 48% funded at that 75-year horizon. This is approximately enough to pay benefits through 2060, according to my back-of-the-envelope calculations.

NALC members on Route 2 near Jack Reed's office

Obviously retiree health care is part of the employment contract, and should be counted as an operating expense, but that’s not the same as saying that pre-funding 75 years worth of expenses in 10 years is the right way to go. On the contrary, the USPS experience says it is exactly the wrong way.

The Postal Service is not without business challenges. The shift from regular mail to email has taken a big chunk of postage revenue with it, and it’s not likely to come back. But the moaning you may have read about how the USPS can’t make it in an electronic world is mostly uninformed. The fact is that the business operations are covering the costs by most reasonable measures and a few simple changes, like adding some counter services, or offering email, as lots of other countries do, would provide more revenue.

Unfortunately, instead of questioning the decisions of accountants, the USPS managers are bowing to them, and planning to close post offices in 2012, processing facilities in 2013, and end Saturday delivery in 2014, all in order to fund retiree health care in 2091. All these changes will make service slower and less convenient for all of us. The S1789 bill makes this possible.

There is some good in the bill. It does slightly relieve the pre-funding mandate of the retiree health care. But it doesn’t do enough. It also doesn’t allow USPS to use its pension surplus to pay for the retiree health care shortfall. It doesn’t loosen up the crazy restrictions on USPS businesses, like offering notary services, or contracting for delivery services.

So that’s the story: there is trouble afoot in the world of the Post Office, but it’s not a crisis. What makes it a crisis is the absurd accounting rules, and the restrictions on USPS businesses. Please tell Senator Reed to reject this bill and vote for a bill that actually addresses the real problems in a sensible way.

Budgeting for Disaster: How RI Pays for URI


Deprecated: Function get_magic_quotes_gpc() is deprecated in /hermes/bosnacweb08/bosnacweb08bf/b1577/ipg.rifuturecom/RIFutureNew/wp-includes/formatting.php on line 4387

Deprecated: Function get_magic_quotes_gpc() is deprecated in /hermes/bosnacweb08/bosnacweb08bf/b1577/ipg.rifuturecom/RIFutureNew/wp-includes/formatting.php on line 4387

Should URI Faculty get a 3 percent raise? Let me tell you a story and you decide.

URI is the big kahuna among the three institutions run by the Board of Governors. It educates about 16,000 students, around 10,000 of whom are from Rhode Island. Researchers there pull in about $80 million each year in research funding, largely from federal sources, like the National Science Foundation and the National Institutes of Health, but also from corporate sources.

There are some important financial issues going on at URI, and none of them are about raises for faculty. One is that state dollars continue to decline in importance to URI’s budget. Twenty years ago, state general revenue funding of $57 million provided about a quarter of the overall budget of $214 million. Today, we provide $75 million for a budget of $705 million, or just a tiny bit more than 10% [B3-46], making URI essentially a private university with a small public subsidy. State contributions over that time grew at an average rate of 1.3 percent per year while the overall budget grew more than four times as fast.

The Governor is proposing to raise the state’s contribution by a little more than $3 million, which is $2 million more than level funding, so that will hike the percentage of the budget contributed by the state a smidge.

But wait, shouldn’t we be concerned about growth of more than 6 percent a year? Why yes, we should. This is a national problem; universities across the country are seeing this kind of cost inflation. Tuitions are pretty much the only thing around that rivals health care costs in the inflation department.

So what is URI spending its money on? Answer: Not professors. To teach more or less the same number of students, URI has almost a hundred fewer professors than it did in 1994. (I’ve used the 1994 personnel budget in this, because they changed the presentation that year and it matches the 2013 presentation better.) In 1994, the “Education and General” part of the budget had 623 professors of the three ranks (full, assistant, and associate), and in 2013, we expect to have 540. The collection of all full professors have seen their pay climb about 2.8% per year over that time.

Looking at the administration shows a different picture. The top couple dozen administrators—the deans, provosts, and vice presidents—have seen their pay go up an average of 4.5 percent per year. There aren’t more people at the top level of administration, but in 1994, there were 65 people with the title of “Director” of something (or assistant director), and in 2013, there are 89. Individually, their salaries didn’t grow quite as fast as all the deans’ and vice-presidents, but because there are so many more of them, they also saw approximately a 4.5 percent average growth rate.

That kind of growth is high, but doesn’t make it to 6%. How about capital projects? In 1994, URI spent $6.4 million on construction and debt service. This year we’re looking at $68 million, and next year it will come down to $59 million. This is a growth rate of 13 percent a year! If you walk around one of the URI campuses, you’ll see lots of new buildings. But few of them are very crowded.

The other huge growth is in the account that provides student aid to cover rising tuition costs. Tuition this year is expected to go up 9.5% as it has for a number of years in the past. Consequently, the aid bill also rises very fast.

So that’s the story: declining aid from the state, declining numbers of professors, increases in administrator pay and numbers, construction of fancy new buildings, and huge increases in tuition. The construction part makes it seem like investment, but all together, does that really sound like an investment in education to you?

There’s another dimension here. By 1995, URI had already lost a tremendous proportion of its state aid budget. In 1989, state dollars covered 58 percent of the budget, but by 1994 it was down to a quarter. This was a crisis. The University (under its new President Robert Carothers) responded by doing a revenue analysis of all the departments, to see which ones made money, and they abandoned most of the programs that didn’t. They stopped admitting students in 47 degree-granting programs, including 16 in science and engineering. From a financial perspective, this seemed to make sense, though it was virtually unprecedented in American university administration.

From an academic perspective, the benefit was hardly as clear. Consider philosophy. URI still teaches some introductory level philosophy courses, so they still need some faculty. So if you love philosophy enough to pursue a doctorate in it, what URI has to offer you is a career of teaching classes to students who don’t really care about it. This immediately makes URI a second choice for anyone in that field. Maybe you don’t care about philosophy, but there were 46 other programs that got the same treatment.  Is that the best way to get good faculty?  How about not giving them money?

Now I learn from a 2010 “Research and Economic Development” presentation to the URI Strategic Budget and Planning Council that over the ten years from 1996 to 2006, URI saw its research funding grow by 29 percent. Over that same time, UNH saw its research funding up by 271 percent, UVM’s went up 162 percent, and UConn saw its funding rise 136 percent. (All larger than the national average of 117 percent.) This was immediately following that downsizing. Do you think maybe this could have been related to a shrunken faculty? Downsized programs?

The presentation was clearly meant to show how worried the University should be about this poor showing. After all, after educating students, research is most of the point of an institution like URI. Research brings in grant funding, research builds prestige, and research is where the real economic benefit of universities comes from.

But not to worry. The folks who put together this presentation had a plan, which was, I gather, put into action. Their plan: Create a new Vice President.

Read previous posts from this series

Budgeting for Disaster: Cutting the Buddha


Deprecated: Function get_magic_quotes_gpc() is deprecated in /hermes/bosnacweb08/bosnacweb08bf/b1577/ipg.rifuturecom/RIFutureNew/wp-includes/formatting.php on line 4387

Deprecated: Function get_magic_quotes_gpc() is deprecated in /hermes/bosnacweb08/bosnacweb08bf/b1577/ipg.rifuturecom/RIFutureNew/wp-includes/formatting.php on line 4387
FY2013 budget

FY2013 budgetOur budget tour continues with a visit to the Behavioral Healthcare, Developmental Disabilities and Hospitals. The acronym is BHDDH and I’m told by insiders it’s pronounced “buddha.”

BHDDH is spending more time than usual in the news. This is largely because last year they cut $26 million from the budget that would have gone to private providers of care for disabled adults. You can see the cut on page 153 of Volume II of the budget (or page 17 of this excerpt), second line, where $206 million in 2011 went down to $180 million in 2012.

This is a cut about three times as big as Governor Chafee proposed. But if you remember, the General Assembly rejected Chafee’s sales tax changes, so they had to cut much deeper than he’d suggested.

Some background: Rhode Island provides services to these people in two ways. About 220 get services through Rhode Island Community Living and Supports (RICLAS), a state program, and a bit more than 3,000 others get services through private agencies who bill the state for their service. These agencies are almost wholly dependent on those bills.

BHDDH recently commissioned a big study of the matter and determined that the state actually doesn’t pay very much for this service. Over the last few years, the population under care grew slower than any northeast state besides Massachusetts, and we reduced the per capita expense from $76,803 in 2009 to $63,013 in 2011. This is despite being one of only nine states (out of 44 where data was available) without a waiting list for services. In other words, we appear to be getting pretty good service for our money.

There is another side, though. We get this great value by paying people very little. The going rate for direct support staff at the private facilities appears to be between $9 and $11 per hour, even for the unionized folks. Remember, these are the people who are bathing, feeding, teaching, and otherwise caring for highly disabled individuals. By contrast, direct care staff at RICLAS are paid about twice as much. (Representative Scott Slater has sponsored a bill in to set a minimum wage for direct support staff at these residences.)

Conversely—and somewhat unfortunately—some of the executives at the private organizations are paid far more than their counterparts in the state. David Jordan, the CEO of Seven Hills, who runs homes in Massachusetts, too, was paid $533,214 in 2009. ($265k in salary and the rest in pension contributions.) This year he has responded to the budget cuts by cutting support staff pay by 5% and ending most of their benefits. Executive pay was cut 3%, according to UNAP, the union representing workers there.

So what happens when the administration makes a plan to cut costs and the Assembly says that’s great, but please cut three times as much? Answer: some pretty dumb things.

For example, the state will only pay a fee for service provided, as opposed to a per-person “capitation” rate. This sounds fair, but if an employee shows up an hour late to work, the agency gets docked not only that employee’s pay, but also the overhead costs allocated to that hour of pay. It’s not as if the agency wasn’t responsible for that care, or the heat and electricity didn’t have to be paid for that hour.

The state also changed the way they assess the level of disability for each resident. This affects the amount the state pays for their care. We had been using a four-step measure, but it was changed to a seven-step “Supports Intensity Scale” (SIS). The SIS is probably a better measure, but the four-step scale doesn’t exactly translate over to the seven-step one and the staff to do re-assessments simply doesn’t exist. Result: BHDDH simply decided which levels of the old scale corresponded to which levels of the new scale, and voila, they had to pay less to support the residents.

Actually, what BHDDH says is this:

If SIS has not been performed and client is receiving services then, the resource allocation is based on previously approved level of service cross walked to the new levels effective 7/1/11.


So what do we learn from this? That there isn’t much deference to department plans in the Assembly, for better and worse. If you’re a department director with a plan to cut costs, you should probably only present a fraction of those costs, or risk having your department turned upside down by a demand to cut much more. The promise of cuts is like blood in the water; the sharks don’t care where they bite, and presto you have people mobilizing marches against you. Under these conditions, which director is going to volunteer cuts again?

And we also learn about the downside of privatization. Through aggressive use of private group homes and community-based care, Rhode Island has kept costs low, much lower than most northeast states. But part of the reason we could do that is that the private operators of those homes didn’t have to pay their employees well (and could pay their executives too well). Though I’m sure it would help (at some of the agencies), slashing executive pay won’t make up for the cuts; there simply aren’t enough executives with egregious salaries to make up $26 million.

Overall, administrative costs at the private agencies (about 10%) seem comparable to the RICLAS costs, as far as one can tell from the personnel lists in the budget. More important, because these are private agencies, we have only limited control over them. As some will recall, that was part of the point of the whole privatization push. We were to give up control of services so the invisible hand of the private market could work its magic. Well it has, and here’s the result.

None of this is to say it isn’t possible to squeeze costs down over time, but how much less do we want care-givers to be paid? Though we would like to be able to slowly reduce administrative overhead, the sudden cuts of this past year will not have that effect. More likely they’ll bankrupt one or two of the providers, and that will be a lesson to…someone.

Full disclosure: I have recently done some software consulting work for West Bay Residential Services, one of the DD residential care providers, and may do so again someday.

Update: Clarified the makeup of David Jordan’s 2009 compensation.

Read previous posts from this series

Easy Choice: Meals Tax or Inspection Dereliction


Deprecated: Function get_magic_quotes_gpc() is deprecated in /hermes/bosnacweb08/bosnacweb08bf/b1577/ipg.rifuturecom/RIFutureNew/wp-includes/formatting.php on line 4387

Deprecated: Function get_magic_quotes_gpc() is deprecated in /hermes/bosnacweb08/bosnacweb08bf/b1577/ipg.rifuturecom/RIFutureNew/wp-includes/formatting.php on line 4387
10% is 2 much
10% is 2 much
Is ten percent two much?

I found myself in my favorite local diner the other day, enjoying, well, a heart-unhealthy breakfast, and look what was on my table: a plea to customers to help the Rhode Island Hospitality Association combat the scourge of a 2% increase in the tax on meals. Proposed by Governor Chafee in his 2013 budget, the tax is expected to raise more than $35 million, to be devoted mostly to bolstering local school departments.

Had this new law been in place, my meal that morning would have cost 19 cents more than it did.

This, of course, is reason enough for the Hospitality Association to oppose it violently, to spend lots of money designing and printing up little cards and spreading them throughout diners across the state. Dale Venturini, the executive director, even arranged that some folks dress up in tri-corn hats and throw some tea into the river at a press event in Water Place Park last week, in symbolic opposition to the tax.

I get the point. But there’s another point, one that goes unremarked all too often: nowhere in the press materials I saw about the event. Nor was there a word about what kinds of things would have to be cut without those funds. After all, this is a tax — to be paid by the buyer, not the business — whose function is to provide money to educate children.

Governor Chafee is brave enough to say that education (and non-bankrupt cities) is worth paying for, despite the abuse heaped on him for saying so. Are any of the people who attended that press event brave enough to say what should be cut so their patrons don’t have to pay 19 cents extra for their breakfast? If so, they didn’t put it in the press release, and they weren’t quoted by any of the reporters who were able to be there. Are any of them brave enough to say what else should be taxed? Again, the press release was silent on the point.

But what does this have to do with the Department of Health?

Think back a year. What was in the headlines? An outbreak of salmonella from poorly-stored zeppole, that’s what. Sixty-six people got sick and two died. Here’s what I learned during that outbreak: Rhode Island has just seven food inspectors to keep track of 8,000 establishments. Connecticut has 360 inspectors to deal with 19,000. That is, to deal with slightly more than twice as many restaurants, stores, and other facilities, Connecticut has 51 times as many inspectors. Each inspector in that state is responsible for a little more than 50 establishments. In Massachusetts, the work load is higher, and each inspector looks after 150. In Rhode Island, each inspector is responsible for over 1,100. We’d need a staff of 53 in order to have the Massachusetts work load. Instead we have seven.

If each inspector is responsible for 1,100 businesses and there are about 200 workdays in a year, how many times a year do you think each one gets a visit? Is that enough? Remember, there are actual lives at stake here.

Dale Venturini—last year—said to a Providence Journal reporter that the association had long lobbied for more food inspectors. The Hospitality Association had even begun to perform its own “food safety audits” which are sort of like state inspections, except without the penalties. This year, Governor Chafee heard the call, and the budget contains six new inspector positions [B2-64, under “Environmental and Health Services Regulation”]. This is about one seventh as many as we’d need to get to Massachusetts-level staffing, but it’s a start and it would almost double the chances of any particular restaurant getting an inspection.

So here’s the question: If the Hospitality Association successfully kills the meals tax, should we abandon those plans for new inspectors and put that money toward education? If not, why not? We have several cities either in or contemplating bankruptcy, due in large part to cuts in state aid and rises in the cost of health care, whatever you may hear about pensions. We have a shiny new funding formula for education that, as it turns out, ignores the cost of heating school buildings (see here, question 13) and maintaining them. A budget is just a statement of spending priorities. A critique of the budget should be the same. The Hospitality Association says education spending is not worth 19 cents on my breakfast. And it also says more food inspectors are important. More important than what?

Dale Venturini is on record demanding an increase in state spending. But where should the money come from? I eagerly await the next press release from the Hospitality Association on the subject.

Department of Education Posts Funny Numbers


Deprecated: Function get_magic_quotes_gpc() is deprecated in /hermes/bosnacweb08/bosnacweb08bf/b1577/ipg.rifuturecom/RIFutureNew/wp-includes/formatting.php on line 4387

Deprecated: Function get_magic_quotes_gpc() is deprecated in /hermes/bosnacweb08/bosnacweb08bf/b1577/ipg.rifuturecom/RIFutureNew/wp-includes/formatting.php on line 4387
Woonsocket High School (photo courtesy of Woonsocket School District)

What do you think about our state’s shiny new education funding formula? Neither Woonsocket nor Pawtucket are big fans and they are headed to a court date next month with the RI Department of Education (RIDE) over it.

Using measures that used to be part of the funding formula, these two cities are taxed more heavily than any other city or town in the state, save only Providence and Central Falls.  But RIDE only suggests they raise taxes more instead of counting on state aid.

To great fanfare in 2010, the legislature enacted a new funding formula to dictate how much state money is shared with the state’s cities and towns.  The new funding formula was widely praised for taking the uncertainty out of education funding for the state’s school districts.  There are a couple of problems, though.

The first, and biggest is simply that the funding formula does not provide enough money to the places that need it the most.  The school committees of Woonsocket and Pawtucket have filed a suit against the state over the adequacy of the funding for education.  In a fairly catty reply to press coverage of the suit, RIDE put out a packet of graphs showing that over the past 10 years, Providence tax collections have risen repeatedly while Pawtucket and Woonsocket have not.  RIDE calculated that if Woonsocket and Pawtucket had increased their tax levy by as much as Providence had, Pawtucket would have $2000 per student more to pay for education, and Woonsocket $1240 more.

The clear message: Providence has done what it takes, and raised taxes substantially over the past 15 years and Woonsocket and Pawtucket have not.  What a bunch of slackers, right?  Maybe the supplemental tax under consideration in Woonsocket to fill their budget hole is just catching up for a decade of bad behavior?

Of course the problem with the RIDE data is that Woonsocket and Pawtucket were already heavily taxed 15 years ago.  All this data shows is what the increase in taxes has been.  How heavy are the taxes in those cities?  Has that changed in the last 20 years?

There is a better way to look at this.  A number called “Tax Capacity” measures the relative wealth of cities and towns, and another number called “Tax Effort” measures the amount of that wealth that is actually taxed.  These numbers used to be part of the funding formula — the version that was ignored during the last 15 years — and their definition is in state law (16-7.1-6).  RIDE publishes these numbers on their Infoworks web site, but they use the 2008 data, and several of the values are wrong, possibly typographical errors.  (The errors have been brought to RIDE’s attention, but they have neither defended the numbers nor changed them.)

But with the formula laid out in state law, anyone can calculate tax capacity and tax effort, so here they are, using 2010 and 1990 data, ranked by 2010 tax effort.

Municipality Tax Capacity Tax Effort 1990 Capacity 1990 Effort
Providence 31.99 266.69 52.25 199.42
Central Falls 14.18 227.04 22.56 255.17
Woonsocket 27.95 218.75 46.46 163.61
Pawtucket 32.14 199.99 56.36 134.54
North Providence 57.96 173.82 82.36 109.62
West Warwick 59.25 148.32 76.11 105.27
Cranston 74.85 143.92 98.90 101.32
Johnston 89.71 127.47 98.16 100.01
East Providence 74.46 124.05 94.45 102.59
Warwick 105.71 118.28 114.16 111.69
Glocester 100.74 105.64 100.72 103.42
West Greenwich 136.97 103.69 127.14 98.71
Tiverton 100.89 103.34 119.27 77.35
Hopkinton 102.63 103.34 93.73 88.76
North Smithfield 109.08 102.47 128.73 75.36
Warren 100.79 97.88 87.90 105.25
Foster 118.45 97.65 113.93 106.14
Richmond 105.32 91.88 90.36 103.55
Lincoln 137.63 89.19 129.73 90.57
Coventry 90.97 88.62 86.32 91.72
Smithfield 127.90 87.08 119.00 84.65
Burrillville 84.58 86.34 75.99 95.80
Scituate 144.76 82.21 141.15 70.86
Middletown 155.20 79.26 104.08 83.13
Cumberland 105.12 76.54 111.39 80.11
North Kingstown 162.68 75.52 147.41 79.21
East Greenwich 223.05 72.81 226.97 63.86
Barrington 232.53 70.32 208.23 67.09
Exeter 141.01 67.07 96.87 85.42
South Kingstown 158.75 66.63 123.55 80.64
Bristol 118.14 62.62 95.31 79.72
Newport 195.41 62.52 136.90 91.27
Westerly 223.38 61.82 175.68 62.07
Portsmouth 217.32 57.84 149.34 72.72
Narragansett 257.28 53.30 212.11 60.18
Charlestown 298.42 44.52 247.45 52.99
Jamestown 384.86 43.61 306.80 43.23
New Shoreham 1670.44 22.17 1062.39 35.24
Little Compton 648.51 21.52 346.28 37.87

(The 1990 data is from the 1992 “Annual State Report on Local Government and Finance” put out by what was to become the Office of Municipal Finance.  The 2010 levy data was provided to me by OMA and the assessment data is at muni-info.ri.gov.  I also used census data from 1990 and 2010.)

What you see from this table is that Woonsocket and Pawtucket were already among the most heavily taxed towns in the state in 1990.

These are relative numbers, where 100 is the state average in each column, so you can’t compare the 1990 to the 2010 numbers directly, but you can look at the growth of the indicators behind them.

Between 1990 and 2010, the assessed value of property in Woonsocket, equalized and weighted according to another formula in state law so one town can be compared with another despite differences in assessment calendars and practice (it’s called EWAV, and it includes an adjustment for the town’s median income) rose more slowly in Pawtucket and Woonsocket than in any other municipality in the state, an annual rate of 3.8% for Pawtucket and 3.86% for Woonsocket.  Over those same 20 years, the EWAV values in Providence rose an average of 4.8% each year.  By comparison, Warwick saw growth of 6.3% per year, and Portsmouth saw 9.0%.

Here’s the data (EWAV is in thousands):

Municipality 2010 EWAV 1990 EWAV Growth Rate
Pawtucket $3,013,403 $1,427,388 3.80%
Woonsocket 1,516,559 710,634 3.86
Providence 7,505,015 2927,949 4.81
Central Falls 362,161 138,758 4.91
North Providence 2,449,538 921,354 5.01
East Providence 4,614,434 1,658,822 5.24
West Warwick 2,278,583 776,596 5.52
Cranston 7,927,256 2,622,321 5.68
Warwick 11,513,435 3,399,716 6.28
Tiverton 2,097,388 595,065 6.50
North Smithfield 1,719,858 471,040 6.68
Johnston 3,400,091 908,254 6.82
STATEWIDE 138,666,859 34,979,107 7.12
Glocester 1,293,518 323,974 7.16
Warren 1,409,088 348,860 7.22
Scituate 1,969,910 482,021 7.29
East Greenwich 3,862,957 938,751 7.32
Cumberland 4,640,261 1,127,569 7.32
Burrillville 1,777,974 429,962 7.35
Foster ,718,814 171,410 7.43
Barrington 4,996,527 1,150,455 7.61
Coventry 4,196,466 935,387 7.79
Smithfield 3,610,988 794,954 7.86
North Kingstown 5,676,661 1,222,312 7.98
Middletown 3,302,183 706,047 8.01
Lincoln 3,826,882 816,075 8.03
Newport 6,351,713 1,347,027 8.06
Narragansett 5,378,526 1,108,006 8.21
Hopkinton 1,107,157 224,583 8.30
Bristol 3,572,581 718,532 8.34
Westerly 6,706,033 1,323,097 8.45
Jamestown 2,740,490 534,634 8.51
Charlestown 3,077,225 558,787 8.90
Portsmouth 4,978,614 877,550 9.06
South Kingstown 6,408,042 1,060,821 9.40
Richmond 1,069,497 168,553 9.67
Exeter 1,193,592 184,403 9.78
West Greenwich 1,107,062 154,772 10.33
Little Compton 2,983,453 403,052 10.52
New Shoreham 2,312,906 309,597 10.57

In other words, not only were Pawtucket and Woonsocket among the most heavily taxed communities in the state in 1990, but over the last two decades they had less growth in their capacity to levy taxes than any other town in the state — including Central Falls.  Providence raised more money over the last two decades than either town, but they also saw substantially higher growth in their capacity to do so.

It’s easy to cluck one’s tongue about the slackers in Woonsocket and Pawtucket, but the evidence is that those city governments may have known something about their cities that the data crunchers at RIDE don’t.


Budgeting for Disaster: Medicaid in the Budget


Deprecated: Function get_magic_quotes_gpc() is deprecated in /hermes/bosnacweb08/bosnacweb08bf/b1577/ipg.rifuturecom/RIFutureNew/wp-includes/formatting.php on line 4387

Deprecated: Function get_magic_quotes_gpc() is deprecated in /hermes/bosnacweb08/bosnacweb08bf/b1577/ipg.rifuturecom/RIFutureNew/wp-includes/formatting.php on line 4387
FY2013 budget

FY2013 budgetIn volume II of the budget, you’ll find there the Executive Office of Health and Human Services (EOHHS), which contains the Departments of Children Youth and Families (DCYF), Health (DoH), Human Services (DHS), and Behavioral Healthcare, Developmental Disabilities, and Hospitals (BHDDH).

Collectively these departments spend over $3 billion, about 40% of the overall budget. In the Governor’s budget, only about 40% of that is actual tax dollars, and the rest is either federal money or restricted receipts, such as fees for service.

The big kahuna in the Human Services budget is, of course, Medicaid, so we may as well begin there. The expense for Medicaid has been moved from the DHS budget to the umbrella EOHHS. This, of course, means nothing to the budget’s bottom line, only that the accounting for that expense appears on page B2-118 for years before FY12 and before, and on B2-12 for FY13 and beyond.

So much for where to find it. How much is it? The Medicaid budget for next year is projected to be $1.66 billion, approximately the same as was originally budgeted for this year.

The same as this year? But what about the skyrocketing medical inflation? It’s there, but masked by offsetting cuts in service. The “Managed Care” portion of Medicaid that you see in the breakdown of the Medicaid costs is also known as RIte Care, and it has more than doubled in ten years, though it still amounts to only about a third of all the Medicaid. The annual cost increase for Managed Care has been about 7.5% each year. Eligibility rules tightened, but demand increased, so that includes a very minor decrease in enrollment over that time. What’s worse, federal reimbursement paid for 55 cents of every dollar in 2003, almost 64 cents in 2010 (part of the stimulus package) and only 51 cents in 2013.

In order to control these costs, the state has added or increased co-pays and restricted eligibility several times in recent years. Apart from that, there has been little more than some studies and planning from Lt. Governor Elizabeth Roberts in response to this ongoing disaster—remember, this affects everybody, not just the state budget—and this year is no different. The Governor’s 2013 budget will cut all dental care for adults to save $2.7 million. “Refinements to Medicaid managed care programs” will save another $2.5 million [ES-56]. Lots of these refinements involve cutting services, though some, like providing more care through “Patient-Centered Medical Homes” are potentially good ideas, depending on how they’re implemented.

One problem with the push for managed care is that in some cases it may well insert a new layer of bureaucracy where none is needed. A director of a residential care provider pointed out to me that his agency is already providing managed care for most of their residents. That is, with the advice of a consistent array of medical professionals, the agency selects care options for its residents. This is pretty much what the medical home concept suggests. If new requirements simply force them to add a layer of doctors to what they’re already doing, it won’t necessarily reduce any costs or improve any care. (It also calls into question the cost savings estimates for the managed care push.)

The other big component of cost saving in Medicaid is a proposal to save another $14 million by simply paying 4% less for the care.

Paying less? Who knew you could just solve the health care cost problem so easily. Why didn’t we think of this years ago? But yes, the Governor’s budget proposes paying 4.14% less for all Medicaid coverage that require a monthly per-person fee (“capitation”). This is mostly Neighborhood Health Plan, though  United Health also has a share of that market. Neighborhood, though, has the misfortune of being in the business of serving the Medicaid population almost exclusively, so they will be much harder hit than the other two. Obviously any cost cutting reform has to start somewhere, but it’s hard to see how this will do the trick.

It’s worth an aside here to mention one of the factors in health care cost inflation that seems never to come up in serious discussions of the rising cost of health care. After all, what’s the fastest-growing component of a medical practice’s expenses? More likely than not, it’s health insurance for its employees. For all the fancy machinery of modern medicine, it’s still a labor-intensive business. A giant facility like Rhode Island Hospital puts more than half its budget towards salaries, and a small practice will see an even higher fraction, 70% or more.

A physician’s assistant earning $65,000 a year is probably receiving a health benefit worth around 20% of that if he or she has a family. What’s more, all those pharmaceutical firms, medical device manufacturers, and bandage makers also have to deal with rising health care costs. In other words, a significant part of what an increase in health care costs pays for is… an increase in health care costs.

This sounds like a dopey little irony, but engineers call this a feedback loop, and electronic systems with less feedback than this also spiral out of control. Obviously there are plenty of factors driving health care inflation—not least the vast number of people who see health care as a way to get rich—but at root, linking health care and employment creates an unstable system, prone to amplify increases.  Could that not be worth some attention?

Next: Food inspection dereliction
Read more from this series


Deprecated: Function get_magic_quotes_gpc() is deprecated in /hermes/bosnacweb08/bosnacweb08bf/b1577/ipg.rifuturecom/RIFutureNew/wp-includes/formatting.php on line 4387