Payday Lenders Hire Power Broker Bill Murphy


Deprecated: Function get_magic_quotes_gpc() is deprecated in /hermes/bosnacweb08/bosnacweb08bf/b1577/ipg.rifuturecom/RIFutureNew/wp-includes/formatting.php on line 4387

Deprecated: Function get_magic_quotes_gpc() is deprecated in /hermes/bosnacweb08/bosnacweb08bf/b1577/ipg.rifuturecom/RIFutureNew/wp-includes/formatting.php on line 4387
Former Speaker of the House Bill Murphy (photo by Ryan T. Conaty: ryantconaty.com)

One of the most interesting battles going on in the state house this year is over the fate of the “payday lending” industry. Payday loans are short-term loans, typically arranged something like this: I loan you $100 now in return for $110 taken from your next paycheck in a couple of weeks.

This sounds good, unless you do the math and notice that this works out to about a 260% annual interest rate.  If you don’t, it’s likely enough that in two weeks you’ll ask for an extension, and it only takes a couple of dozen like you and suddenly my business is booming.  And there are a lot more customers than that around here.

It wasn’t legal to charge interest rates that high until an exception to usury laws was carved out for check-cashing businesses in 2001. According to Margaux Morisseau, who is spearheading the effort to repeal this exception, payday lenders in Rhode Island now write over 140,000 of these loans each year, totaling $50 million, the bulk of which are written by Advance America, based in South Carolina, and Check ‘n Go, nominally based in Ohio, though it might be controlled by partners based in Texas or London. You can admire the process at rhodeislandpaydayloans.com. My favorite quote:

“When it is due date of your RI payday loan, the loan amount and the service charge will be automatically debited against your pay check. An extension of your RI cash advance is also possible by paying an extension fee.”

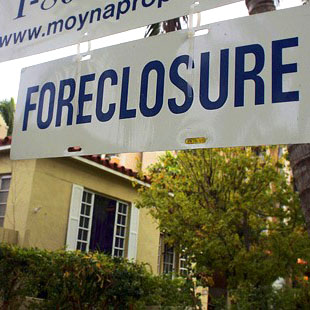
There are a couple of interesting points to the story (beside the lack of proofreaders for web content). First, it is consistently astonishing to me both how profitable it can be to exploit poor people — and how many financiers are eager to do so. After all, a huge amount of the financial carnage of the 2008 meltdown was built on liar loans and various kinds of mortgage fraud aimed at sucking wealth from low-income families who hoped to afford a home. (And no, the Community Reinvestment Act had nothing to do with this, as you’ll doubtless read in uninformed comments.)

Obviously there is a risk associated with these kinds of loans, but even assuming a generous loan loss provision, we’re talking about more than doubling one’s investment each year. These are returns investors in more, um, traditional businesses can only dream of.

There’s a bill in the Assembly that would repeal this exception and limit interest to 36% — still awfully high, but in the range that banks charge on some credit cards.  Morisseau has put together an impressive coalition to push it, and Representative Frank Ferri and Senator Juan Pichardo have been very energetic sponsors. Morisseau and Ferri found 50 co-sponsors out of 75 members for the House Version, and she and Pichardo got 25 out of 50 in the Senate. Sounds like a slam-dunk, right?

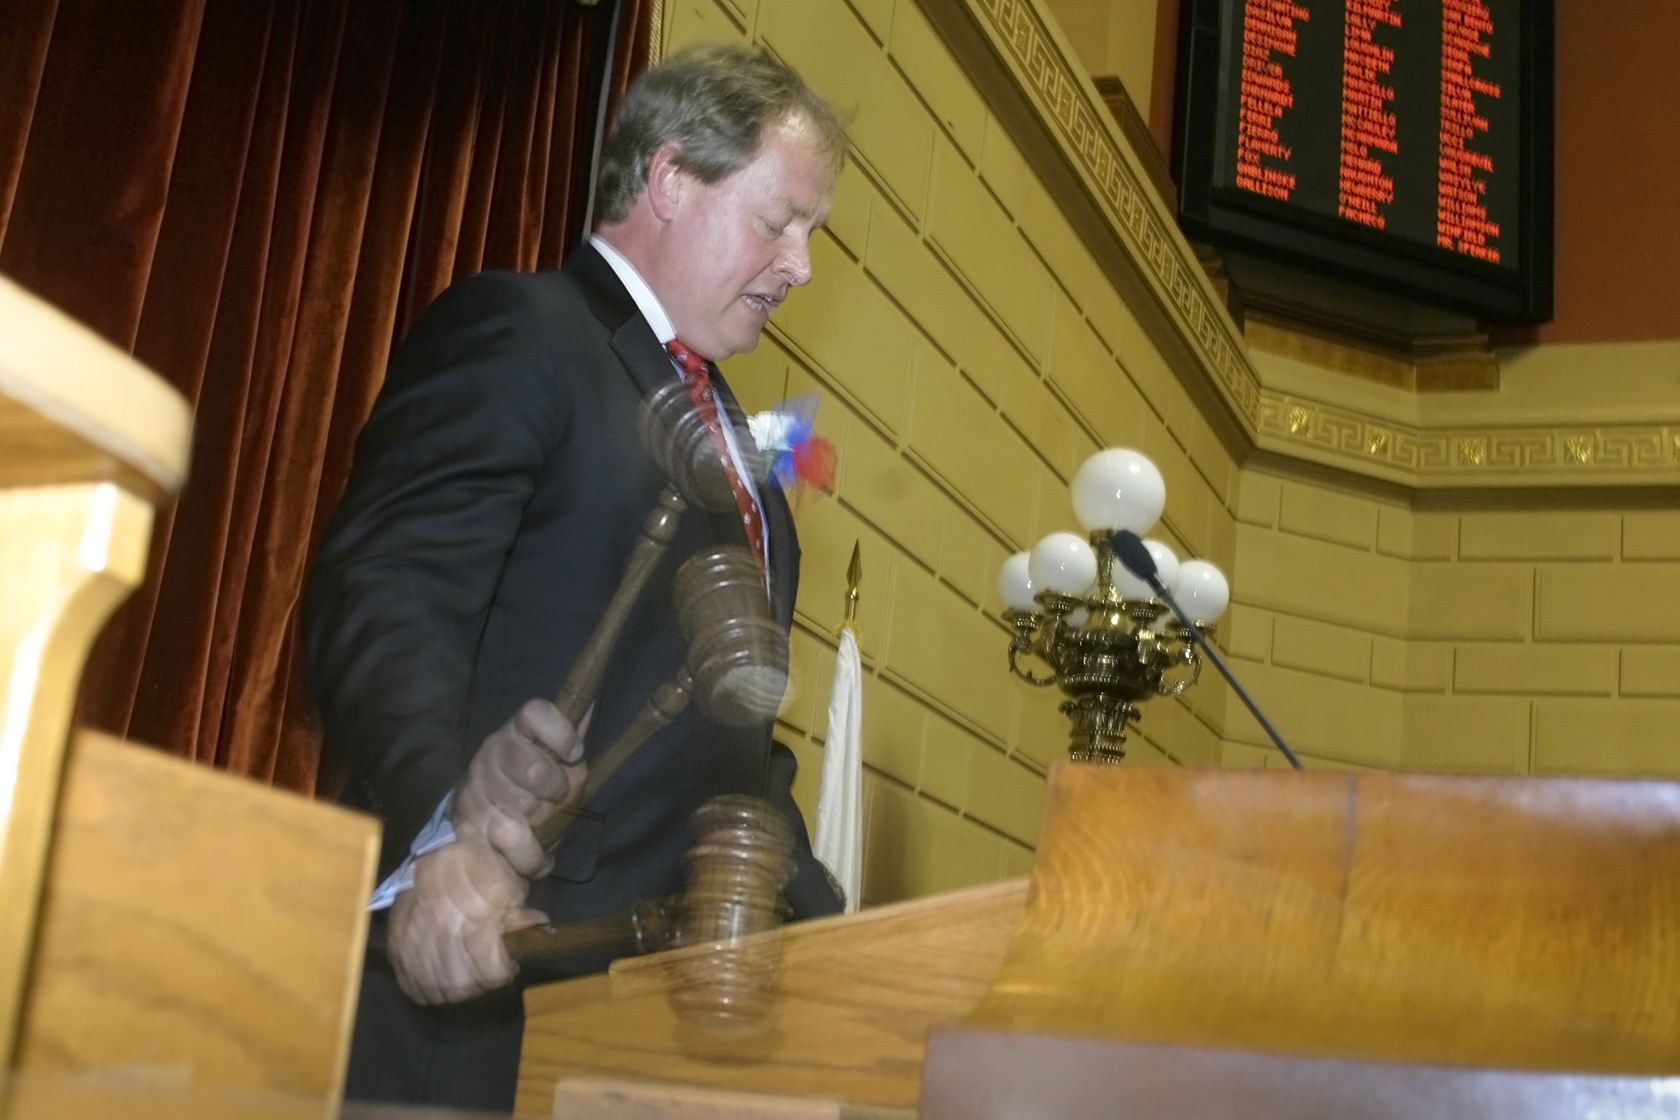
Wrong. On the other side, Advance America has retained Bill Murphy, the recently retired Speaker of the House.

So what can a retired Speaker do in the face of 50 house members who oppose him?  Sure he knows where a lot of bodies are buried, but what can he possibly hold over so many people?  How is this a fair fight?

Here’s how it works. Murphy’s services are not provided gratis to Advance America. They are paying him $50,000 this year, according to the Secretary of State’s web site. How much work will that entail?  A bunch of phone calls and a handful of meetings. Nice work if you can get it.

And you can get it if you try — so long as you’re a current member of the House or Senate leadership. If Bill Murphy can prove to Advance America that he’s worth $50,000 a year for almost no work, then Speaker Gordon Fox or Majority Leader Nick Mattiello or even Corporations Committee Chair Brian Patrick Kennedy can justifiably claim to be worth the same amount to lobbying clients who happen along after they retire from the House. In other words, killing a bill like this on Bill Murphy’s say-so is key to a big payday for them down the road. Preserving a system that benefits Murphy is the way to keep the trough full at which they might hope someday to feed.

Of course, there are lobbyists who do real work for their money — arranging testimony, doing research, preparing press campaigns — and some of those are even ex-legislators. But the real money is in having a name that can make things happen despite how many are on the other side.

Now in fairness, I have no idea whether Fox, Mattiello, or Kennedy hopes to cash in on their service in this way, and in all likelihood, neither do you. But a very compelling indicator of whether they do is if this bill — sponsored by two-thirds of the House — gets out of committee and onto the House floor for an actual vote. Are the people who control the agendae of the House and Senate interested in a democratically run General Assembly, or is their interest in preserving the system by which ex-legislators profit handsomely from what was, in theory, public service?

Appendix:

For comparison,

Dan Connors, former Senate Majority Leader

George Caruolo, former House Majority Leader

Stephen Alves, former Senate Finance Chair


Budgeting for Disaster Part VII: Quasi-appropriate?


Deprecated: Function get_magic_quotes_gpc() is deprecated in /hermes/bosnacweb08/bosnacweb08bf/b1577/ipg.rifuturecom/RIFutureNew/wp-includes/formatting.php on line 4387

Deprecated: Function get_magic_quotes_gpc() is deprecated in /hermes/bosnacweb08/bosnacweb08bf/b1577/ipg.rifuturecom/RIFutureNew/wp-includes/formatting.php on line 4387
FY2013 budget

FY2013 budgetTrick question: Why is Rhode Island’s housing policy not made by the state government? How about economic policy? Why do we have two environmental agencies? Two elections agencies?

The questions sound unrelated, but they have very similar answers, and they’re all related to the state’s bevy of “quasi-public” agencies—whose budgets are in Volume I of the budget.

The Airport Corporation is here, who runs all the state’s airports, including Green. The Economic Development Corporation is also here, along with Rhode Island Housing, RIPTA, the Narragansett Bay Commission (sewers in Providence and Pawtucket), the Resource Recovery Corporation (runs the central landfill), and several others.

Truthfully, it’s more correct to say the outlines of their budgets are in Volume I [B1-331-366]. There isn’t much information there about some very important agencies, and in some cases this was part of the point of keeping them separate from the regular parts of the state government.

Some of the quasi-publics were formed when the state took over existing private corporations. RIPTA, for example, was formed to save the last private bus company. Others have a separate existence for legal reasons. The Turnpike and Bridge Authority, which maintains the Pell and Mt Hope Bridge, was formed to issue bonds against the toll revenue collected at those bridges. But many quasi-publics—along with some other agencies less quasi and more public—were formed out of power struggles between the legislature and the governor.

The Coastal Resources Management Council, for example, our extra environmental agency, was originally formed in the 1970s so that powerful members of the legislature could circumvent new DEM coastal regulations on behalf of their friends who owned waterfront property. Rhode Island Housing (technically the RI Housing and Mortgage Finance Corp.) may have originally formed to access some federal HUD funding, but it was also a creature of the legislature, witness the mortgage scandals of the 1980s. Later, under a stronger Governor, the Economic Development Corporation was created out of the Department of Economic Development to give the Governor Lincoln Almond more control over economic policy (and to pay its executives more like the corporate executives they lunch with).

EDC has another distinction. When it was spun out of the government into a quasi-public, it took over the shell of the RI Port Authority. Why? Because after Bruce Sundlun effectively put the Public Building Authority out of business (it was a campaign promise), the Port Authority was the only agency with unlimited authority to borrow money without voter approval. And boy have they used that authority. EDC now owes debt used for the Fidelity campus in Smithfield, the Shepard’s building in Providence, the Masonic Temple hotel across from the state house, the I-Way boondoggle, the Sakonnet River Bridge, and much more. Subsidiaries owe the debt used to build the airport and renovate Quonset.

Under Ed DiPrete, the PBA’s record of borrowing without voter approval was considered a minor scandal and contributed to his election loss in 1990. But none of these subsequent projects got voter approval. Don Carcieri managed to double the state’s debt, and almost all of it was unapproved borrowing, so it’s difficult to remember why it was such a problem for DiPrete.

There will be more to say about this borrowing when we look at the Capital Budget document. For now, let’s look at one of the quasi-publics that spends a lot of time in the news lately over its budget.

RIPTA

The state’s public transit authority was formed when the private bus company that ran transit in Providence and vicinity went under in the 1960s. It wouldn’t be correct to say it has had an untroubled existence until recently, but it did not always have the persistent deficit it has now.

What’s happened to the agency in recent years is a few things. First, like the rest of the state, it is a victim of our crazy health care system. Ten years ago, employee benefits were $10.5 million for a $28.7 million payroll. (For union employees, pension payments are a fraction of the health care costs, though their growth has tracked the health care costs fairly well.) In 2013, we’re looking at $24.8 million in benefits for a $45.8 million payroll [B1-355]. The cost of health care is going up almost two and a half times faster than payroll costs.

Second, transit for disabled people has taken a tremendous number of resources. Paratransit services between 2001 and 2011 more than quintupled, from a cost of $1.8 million to $9.1 million, and there are other categories of service that provide more or less the same function.

Finally, the gas tax has been a problem of its own. A portion of the gas tax is dedicated to RIPTA. The problem is that the gas tax is constituted as a number of pennies per gallon of gas. When gas prices rise, the gas tax actually falls, as people buy less gas. But when gas prices rise, RIPTA’s cost for fuel also rises. In other words, as gas prices rise, RIPTA’s ridership rises, and so do its costs, at exactly the same time that its gas tax revenue falls. Why does it seem that RIPTA is permanently in trouble? Because its funding system makes no sense, and provides falling revenue when expenses rise.

And for those who wonder what is the value of RIPTA to Rhode Island, take it from me that it’s actually pretty hard to get a seat on several of the lines I use frequently. High gas prices mean lots of riders, and also mean service cutbacks.

Unfortunately, pretty much none of the people who make funding decisions about RIPTA—its board, legislators, the Governor or his staff—actually use the system, so it turns out that RIPTA’s funding problems are thoroughly unaddressed in Governor Chafee’s budget. The documents cheerfully predict a $10 million operating deficit by June 2013 so we’ll be seeing lots of RIPTA headlines in the coming year.

Budgeting for Disaster VI: DMV Manages for Success


Deprecated: Function get_magic_quotes_gpc() is deprecated in /hermes/bosnacweb08/bosnacweb08bf/b1577/ipg.rifuturecom/RIFutureNew/wp-includes/formatting.php on line 4387

Deprecated: Function get_magic_quotes_gpc() is deprecated in /hermes/bosnacweb08/bosnacweb08bf/b1577/ipg.rifuturecom/RIFutureNew/wp-includes/formatting.php on line 4387
FY2013 budget

FY2013 budget

One part of the Department of Administration that gets a lot of press is the Department of Motor Vehicles, which is actually a unit of the Department of Revenue. DMV, of course, gets press because people don’t like it, and the lines are long, and it’s in an inconvenient place, and so on and on.

Over last spring and summer, the agency saw a turnaround. Spurred on by stories of multiple-hour wait times, Governor Chafee appointed a new director, who made some management changes, shuffled people around, re-engineered the lines, put “greeters” out front to explain things, closed some satellite branches, and generally shook things up. Lo and behold, the wait times plummeted. An inspiring tale of how good management can make all the difference? A story of re-inventing government to do more with less in the 21st century? Well sort of, but not quite.

Watching the ticking clock in line at DMV has been a part of life for all of us in Rhode Island for a long time, but it’s not right to say that it’s been a neglected problem. Lincoln Almond suggested adding $300,000 per year to expand their hours, and Don Carcieri made a point of “fixing” it, too. He even listed new efficiencies and reduced wait times as one of his accomplishments in a 2004 interview.

But time went on and service decayed until it took hours just for routine business to happen. I waited there with my daughter for three excruciating hours one fine day in 2010, along with about three hundred good friends. By the time Lincoln Chafee took office, DMV was a joke, a travesty of government service. Chafee brought in a new interim director, Lisa Holley, to troubleshoot the agency, and — what do you know? — she got results. Wait times shrank dramatically and while it’s still hard to describe a visit to the DMV as a pleasure, the last time I was in one, last August, I was in and out in 25 minutes.

So what happened? What management magic did Holley bring to the agency? What lessons can we learn? Mostly just that it takes people to do the work.

In the dark days of 2004, when Don Carcieri was taking credit for improving wait times, he was adding employees, and adding satellite locations. You can see the progress in the graph to the right, which counts customer service representatives in the department. Service got better with the new workers, and a little worse with the satellite offices. But then around 2006, Carcieri decided it was ok to let the service decay a little bit. He said the state had too many employees, and he started to enforce the statewide hiring freeze on DMV. And then the retirement fiasco of 2009 came, and a bunch of people left, and so in 2010 you had all the satellite locations, and 22% fewer people to stand behind all those desks.

And that’s the crazy thing about management by attrition: you don’t get to plan for the loss of people. Carcieri simply said we’re not hiring any new people and we’re going to encourage people to retire, and that’s that. The only surprise was that people were surprised that service suffered — a lot.

So again, what management magic did Holley bring? She insisted on having more people, that’s what. Chafee asked the Assembly for 25 new workers. They balked, but they did cough up some, and so now there are almost as many people on the customer-facing staff as there were in 2006, at half as many locations. Of course there were some other improvements: line management systems, those greeters, a redivision of labor. But sometimes the big story is the simpler one: we got better service with more people.

There is another story I see lurking here. Governor Chafee saw a problem of poor service and acted to fix it, while Governor Carcieri saw the problem in terms of taxes, and acted to fix that instead, mostly by giving tax cuts to rich people. How did that work out for you?

There is one other feature to the DMV budget that should not go unremarked while we’re here. The RIMS computer system that was supposed to create a whole new class of efficiencies by getting all of DMV’s information about you in a single database is quite a bit behind schedule and over budget. This is pretty much SOP in the database development world, public and private. That is, it’s a shame and a waste of state dollars, but it’s not exactly unprecedented. I bring it up at least in part because you can’t exactly see it in the budget presentation, but you can see it in the Capital Budget, which we’ll get to soon.

NEXT: The Quasi-Publics
Read the previous posts in this series

Budgeting for Disaster Part V: Granting a Problem


Deprecated: Function get_magic_quotes_gpc() is deprecated in /hermes/bosnacweb08/bosnacweb08bf/b1577/ipg.rifuturecom/RIFutureNew/wp-includes/formatting.php on line 4387

Deprecated: Function get_magic_quotes_gpc() is deprecated in /hermes/bosnacweb08/bosnacweb08bf/b1577/ipg.rifuturecom/RIFutureNew/wp-includes/formatting.php on line 4387
FY2013 budget

FY2013 budgetOur tour of the state budget documents continues. We leave the Executive Summary for the time being (we’ll be back for the all-important schedules and for the invaluable predictions of the future), and move into Volume I.

Volume I covers “General Government”, which includes the offices of all the elected officials, and the departments of Revenue, Business Regulation, and Labor and Training. Plus the Department of Administration which holds all the central functions. It’s also got all the quasi-public agencies like the Economic Development Corporation, RIPTA, the Airport Corporation, and Resource Recovery, who runs the state Central Landfill. For each department and agency, there is a summary page, and then a page for each of the major divisions. This is the part of the tour where the guide is supposed to tell funny jokes to fill up the travel time as you cruise from one interesting locale to the next.

The legislature’s budget is in this volume, so let’s look there first. The overall budget for the Assembly is about $41 million this year, and the Governor is proposing to cut it by a little more than $1 million, about half from supplies and expenses and the rest from the grants budget. There’s no change in the number of personnel, and it looks like they’re anticipating a 3% raise for most everyone, and — what’s this? — it’s the rising cost of health care, just like everywhere else. Remember, no matter what you’ve been told, it’s rising health care costs that are pushing up the cost of your government more than anything else.

Legislative grants

Oh, wait, did you want to hear about the infamous grants budget? This is the source of the legislative grants, random bits of money awarded by the leadership to reward this or that legislator for helping out around the place. It mostly goes to non-profits in the legislator’s home district, like say, Dan Doyle’s Institute for International Sport that we’re hearing so much about these days. They apparently got $575,000 in 2007 for a fabulous building on the URI campus that remains unfinished today.

There are also plenty of excellent, well-run non-profits who get support this way. The problem is that the way these grants are awarded has a lot to do with ring-kissing and begging and maybe not so much to do with merit. Lots of ring-kissers have other merits, but when merit isn’t the main criteria, you’ll undoubtedly get some who are better at the kissing than the service. (This makes the occasional screw-up like the Institute into the fault of some specific person, though no one seems to be saying who just yet.)

How much does it cost? On paper, you’ll see a grant budget line item of $2.8 million in the current year, and the Governor is proposing to cut it back to $2.3 million. The way the system works, though, there is much more than that available. The way it works is that lots of the dollars will wind up as line items on the budget of some agency whose mission is vaguely related to the non-profit’s. So a theatre might get a grant and it would come directly from the RISCA budget, not from this line item. This is a problem both because it provides less money for the agency mission, something that you can’t see from the budget documents, and because counting all those grants isn’t possible from the outside.

What else? One can’t help but notice that despite the modest cut Governor Chafee has proposed, the legislature’s budget is up a healthy 42% in ten years, 2003-2012, about 3.5% per year. This is somewhat less than overall state expenses, which are up 48%, but it’s embarrassingly close to the 42% rise over that time in the statewide property tax levy. One thing you’ll hear if you wander around the halls of the State House and talk to legislators is complaints about out-of-control municipal budgets. What those legislators don’t seem to understand is that the town councils and mayors are doing pretty much as good a job as the legislators.

It’s easy to understand legislators not noticing this. What’s less forgivable is the way they keep voting to cut taxes without cutting their own budget. Over that decade 2003-2012, we saw a capital gains tax cut, an income tax cut for rich people, and several high-profile tax credits pass the Assembly. At none of those times did anyone propose a proportional cut in the Assembly’s own budget. Cuts for thee and not for me. If you care about controlling costs in government, this is the kind of behavior that has to be rendered embarrassing (or at least politically dangerous) for elected officials.

Time to move on. Next stop: DMV!
Read the previous posts in this series.

Budgeting for Disaster Part IV: Lack of Education


Deprecated: Function get_magic_quotes_gpc() is deprecated in /hermes/bosnacweb08/bosnacweb08bf/b1577/ipg.rifuturecom/RIFutureNew/wp-includes/formatting.php on line 4387

Deprecated: Function get_magic_quotes_gpc() is deprecated in /hermes/bosnacweb08/bosnacweb08bf/b1577/ipg.rifuturecom/RIFutureNew/wp-includes/formatting.php on line 4387
FY2013 budget

FY2013 budget

After spending time with Appendix C of the Executive Summmary, it only makes sense to dip into Appendix D, doesn’t it? C was about state aid to the parts of municipal budgets that aren’t education. D is about the much bigger contribution the state makes to education.  Once again, the really interesting things about the numbers in D are how they’ve changed over the years.  (The information is reproduced in the Technical Appendix, page 211, and that table goes back more years.)

You can write an entire book or two about the funding of education in Rhode Island. But this is a tour of the entire budget, so we’re just going to skim some of the important points.

In 2013, the Governor’s budget would provide $674 million to all the cities and towns, to help run their schools, plus another $46 million for charter schools. This is up from $616 million last year, and the difference is revenue from the proposed increase in the tax on restaurants and hotels.

As of 2010, the latest year for which the collected municipal budget data is available, all the cities and towns together spent $1.79 billion on education. To that amount, the state contributed $592 million, plus another $30 million for charter schools.

A couple of points leap out here. The first is that, just since 2010, charter schools have seen a 53% increase in state funding, while everyone else got 15%. You might sniff at that and say 15% isn’t nothing, but in 2008, the traditional schools got $98 million more than they got in 2010, and $16 million more than they’ll get in the proposed budget — the rosiest scenario on the table — in 2013. That is, between 2008 and 2010, they were cut from $690 million to $592 million. The Governor’s proposed increase doesn’t even get back to the 2008 level. Not to belabor the point or anything, but during each of those years, rich taxpayers were granted an increase on the “flat tax” cut.

Oh, and the charter schools? They got no cut at all. Some years they might not have received what they were hoping for, but between 2007 and the present, each year they received more than the previous year. Sauce for the goose is apparently too good for the gander.

Splitting the cost

The other important point you learn from this page is that the state picks up around a third of the cost of education for the cities and towns, or a tiny bit more, depending on whether you’re inclined to count the charter schools or not. Back in the misty dawn of time, under the, um, storied administration of Ed DiPrete, the state’s official goal was eventually to fund 60% of local education costs. At the time, they were at approximately 50%, and there was a plan to get to the goal by sometime in the 1990s.

The plan was undone by the credit union crisis and the fiscal crisis it provoked, but its demise was due at least as much to the weakening influence of municipalities in the state house. Ed DiPrete, for all his faults, had been a Mayor, and seemed to understand the fiscal strains felt at City Hall. Bruce Sundlun, to put it mildly, did not. Nor did his successors, until Governor Chafee. Matty Smith, House speaker during the 1980s, was much more solicitous of the cities and towns than any of his successors have been. There was a lot wrong with the state house of 1988, and I wouldn’t want to go back to that era, but we didn’t have cities and towns threatening bankruptcy, either, did we?

What about cost inflation? Should the state guarantee a proportion of the costs for municipalities who have been unwilling or unable to control the costs of education? This is the point at which people commonly invoke the evil teacher unions. Certainly unions have played a big role in keeping teacher salaries up, but lately they’ve also played a big role in offering concessions to keep costs down. The 2009 edition of RIPEC’s school finance report (the latest one on their web site) tells me that teacher salary inflation in Rhode Island lagged the national average over the previous decade. We spend more per pupil than the national average, but we also live in an expensive part of the country.

The fashion in education reform these days is nattering about how to improve the quality of teachers, but the dominant trend seems to be to find ways to do that without money. I’m not sure what happened to, “you get what you pay for,” but it certainly isn’t the way policymakers think about teachers. So now we have “value-added” ratings and teacher testing mandates and all the rest. The research behind these trends is flawed by some strange assumptions about the teaching profession — it’s a perfect example of sophisticated statistics employed in pointless fashion — but leave that alone for a moment. I can think of only one valid way to judge whether teacher salaries are appropriate: do job ads result in a harvest of excellent resumes? If so, the salaries are appropriate. If not, well, not.

According to the same RIPEC report, Rhode Island has the eighth highest-paid teachers in the country. This is tragic, right? But according to a survey I did a few years ago we also have the seventh highest-paid accountants in the country and the fifth highest-paid veterinarians. Architects, pharmacists, counselors, and other professional jobs, are also paid quite well here. It wasn’t unions who drove those salaries up. The evidence seems that school departments are responding to the vicissitudes of the labor market, just as the employers of those accountants and veterinarians are. People who want me to believe it’s all the unions’ fault have to provide a much more detailed analysis to support their claims than I’ve recently seen.

What else?

There are other important factors beside salaries that push up costs, and some of them are in the personnel column. A recurring theme in budget browsing is the cost of health care, and until the state’s pension payments superseded them recently it was pretty much impossible to talk to a superintendent about costs without hearing about the skyrocketing cost of health benefits. You can’t spend any time with a budget without understanding that bringing down the cost of health care must be a national priority.

What else? How about that federal funding of special education mandates cover substantially less than a fifth of those costs? How about all the mandates of “No Child Left Behind”? The National Governor’s Association voted in 2003 to label both of these “unfunded mandates”, and they have only become more onerous since. How about that despite the calls for consolidation of services, school districts have only become more fragmented in the last decade, as more charter schools come online?

It’s a long list and education funding is a complicated subject — we haven’t covered the new funding formula, the suit from cities who say it’s not fair, the way we fund charter schools, the aid for school construction (“housing aid”), and lots more — but it’s a big budget to cover and it’s time for the tour to move on. Just one last word. Yesterday there was a hearing at the House Finance committee about the proposed hotel and meals tax that would make up a part of the local education funding lost since 2008. Lots of people protested it, but I’m not aware of any who proposed cutting this aid to schools. In fact, I’m not aware of any who were at all specific about what should be cut to avoid this increase. Readers who know otherwise are invited to send along copies of the testimony, and I’ll post them here.

Next: Budget Volume I

Obama tax plan clamps down on private equity

Reviewing reports of last week, I see that buried in the details of President Obama’s corporate tax reform proposal is a rare gem. To be clear, the overall package — basically a reduction of the nominal tax rate in exchange for giving up some of the more egregious loopholes — seems an ok deal. But there is a piece of idiocy in the corporate tax code that hasn’t been addressed seriously since Jimmy Carter failed to get it fixed in 1977. This is the tax advantage of debt over equity.

This sounds dull, but it has a story behind it that is far more revealing about “private equity” than any of the blather you’ve already read about Mitt Romney and Bain Capital.

Imagine, for a moment, Company A with a million dollars in profit and a hundred thousand investors, each of whom paid a hundred dollars for a share. The company takes that million, pays taxes on it, and distributes the remainder to the investors. Say they pay 10% of their profits in taxes (what’s left of the 35% rate, after all the loopholes, and not an unusual number). If the company distributes all its profit as dividends, each shareholder gets $9, a 9% annual return on their investment, which isn’t bad at all.

Now imagine a Company B that also earned a million dollars more than they spent. This one has a hundred thousand bondholders, each of whom loaned the company $100 at 10% annual interest. The company sends $10 to each bondholder, and so reports zero profit, thus zero taxes. The shareholders in B?  Who cares about them?

The structure of these two is pretty much the same: both companies sell their products, pay their expenses, and then distribute the money left over. But one calls those distribution payments “dividends” and the other calls them “debt service” and so the first company pays taxes, and the second does not.

What happens if the economy declines?  Company A will simply send out less money in dividends. Company B will go bankrupt if it can’t meet its debt payments.

Clear enough?  Now imagine some private equity vultures, I mean investors, notice that Company A has built up cash reserves of $10 million. They borrow $50 million to purchase Company A, which is now on the hook for $2.5 million per year. Since they’re only earning a million a year, they have to pay part of that debt service from their reserves, but they can do that for a few years. Also, they get to book a loss, which means they can ask the IRS to refund the taxes they paid for the previous two years. And since they can’t get enough back to make a profit, it’s very unlikely they will pay any taxes at all for a long time to come. They used to pay $100,000 in taxes every year, so over the life of the losses they’ll incur, taxpayers will subsidize the deal to the tune of over $2 million.

This is the point that lots of people don’t understand, or refuse to understand, about “private equity.”  They way those outfits make money is usually by using the tax rules to their advantage, not by increasing corporate efficiency or streamlining processes. A company with exploitable assets could be one with an underutilized factory or intellectual property, but it’s more likely just to be one that has cash in reserve or that paid a big tax bill in the last couple of years. “Assets” like these are much more easily quantified than property and you can estimate them via public documents, something you can’t do with factory outputs or licensing fees.

In other words, that wave of leveraged buyouts that began in the 1980s and ended — well it hasn’t really ended — was largely subsidized by you and me. When RJR Nabisco was bought in 1989 for $21 billion, taxpayers ultimately paid more than $5 billion to the purchasers. This was not the free market at work, it was the tax code encouraging buccaneers like the folks at KKR, Michael Milken, and Ivan Boesky, along with Mitt Romney and Bain Capital. Without the tax advantage of debt over equity, very few of those leveraged buyouts could ever have happened.

Jimmy Carter’s economic team recognized the risk to American manufacturing represented by the tax preference for debt over equity, and addressing it was a central piece of his proposed 1977 overhaul of the tax code. But the change was opposed by business, and he dropped it. Ronald Reagan’s administration made a half-hearted attempt to fix it in 1984, but it went nowhere. Dan Rostenkowski, the longtime head of the House Ways and Means Committee, worked on a proposal in 1987, but it also died. George Bush, Sr., airily said, “I have no agenda on that. I’m always a little wary about the government trying to solve problems when, historically, the marketplace has been able to solve them,” and declined to do anything about the issue. Bill Clinton’s 1995 tax proposals contained a provision addressing the issue, but these were presented during the government shut down episode and did not make it into the final bill resolving that debacle.

So far as I know, that’s the last time there was a proposal on the congressional table to address what has been one of the most destructive tax policies on record. Over the past 30 years, our leaders, with only a few exceptions, have stood by as big finance has devastated our manufacturing sector, laid off hundreds of thousands of people, and done away with their well-paid jobs — and you and I paid for it. I know President Obama’s corporate tax proposal isn’t going to become law in this Congress, but fixing the tax code to eliminate the subsidy for leveraged corporate takeovers is important, and I’m glad someone has put it forward — again.


Budgeting for Disaster – Part III


Deprecated: Function get_magic_quotes_gpc() is deprecated in /hermes/bosnacweb08/bosnacweb08bf/b1577/ipg.rifuturecom/RIFutureNew/wp-includes/formatting.php on line 4387

Deprecated: Function get_magic_quotes_gpc() is deprecated in /hermes/bosnacweb08/bosnacweb08bf/b1577/ipg.rifuturecom/RIFutureNew/wp-includes/formatting.php on line 4387
FY2013 budget

FY2013 budgetWe continue our tour of state budget documents. The Executive Summary  has a lot of useful information, but the parts that I find myself referring to most often are not the text descriptions of the Governor’s program for the various departments, but the numbers in the back: the summary tables, the planning values the Budget Office used to predict the future, the wonderfully informative appendix C, which shows how much state aid each Rhode Island city or town gets, and appendix D, which does the same for education aid.

In a state with one bankrupt city and several more threatening to dive into bankruptcy, these are the focus of a lot of my attention. What deserves at least as much attention are the same sections from previous years. Let’s start with Appendix C.

The first thing you’ll notice if you flip, click, scroll, or slide to Appendix C is that local aid comes in lots of different forms. There is “appropriated aid”, which comes out of the general state taxes (called “general revenue” in the budget), and “shared” (or “pass-through”) aid, which is money the state collects on behalf of a city or town. For example, “payment in lieu of taxes” (PILOT) money is paid to a town instead of taxes on state property, and is appropriated in the budget, while the meals and beverage tax is a portion of the sales tax, collected on behalf of a city or town and passed on to them.

The meals and beverage tax collected in Providence restaurants goes to Providence and the tax collected in Newport restaurants goes to Newport, and so on. The numbers in the appropriated aid represent actual decisions made by legislators and the governor. The shared aid numbers are just estimates of how much those taxes will bring in.

There are a couple of things worth noticing about these numbers. One is that the state is planning to give the cities and towns $61 million in appropriated aid in 2013, which is exactly the same amount budgeted for 2012. Level funding sounds like a cold shower, but compared to recent history, it’s a warm bath. In 2008, appropriated state aid amounted to about $250 million. Or well, it would have, except the legislature cut $10 million halfway through that fiscal year. Providence got a $2.4 million cut, Pawtucket lost $850,000, and Woonsocket lost $600,000. Central Falls was hit for $250,000.

These are cuts in the neighborhood of 1%, which doesn’t seem that big a deal, although they came halfway through the fiscal year, so the cities and towns had to cut around 2% of their expenses to make up for the lost time. For cities under financial stress, this hurt.

For 2009, the Governor proposed a slight increase in aid, back up to $244 million. But once again, this was cut halfway through the fiscal year, to $215 million. Providence was cut $5.7 million, Pawtucket $2 million, Woonsocket $1.4 million, and Central Falls $600,000. Again, the cuts came along well into the fiscal year, making them at least twice as hard to deal with. For Central Falls, this worked out to cutting more than 7% of the annual municipal budget in a few months.

The pretense of maintaining the level of aid was burst by this point, so the Governor proposed cutting municipal aid by 14% for fiscal year 2010, to $184 million. Are you keeping track? To recap: In September 2007, Central Falls was on track to get $3.6 million from the state, or a bit less than a fifth of their budget. By May of 2009, the Governor was suggesting they get by with half that amount, a 10% cut in their budget.

But even that cut wasn’t enough, and with only months to go in the 2010 fiscal year, the state slashed total aid yet again, from $184 million to $118 million. Providence saw a $12 million cut, Pawtucket $5.1 million, Woonsocket $2.8 million, and Central Falls $750,000. This time, quite a bit of the cut came in the last quarter of the year, leaving virtually no time to make up the cuts. And for the 2011 budget Carcieri proposed to cut total municipal aid all the way down to $49 million. That year, insurgents in the Assembly pressured the leadership to put a little aid back in the budget, but it still only got up to $60 million, down 76% from just three years before.

I’m sure it was a coincidence that Central Falls went into receivership in May of 2010. At least the way everyone talks about Central Falls, their bankruptcy was all the fault of their unions and retirees, and the state played no part besides offering them a receiver to work out their issues. Their annual budget was $18.9 million in 2008, of which $3.6 million was state aid. In 2010, they were promised only $1.8 million, but got only $1.1 million. And in 2011 they didn’t even get half of that.

In 2008, Providence expected to get $65 million from the state, to help with its $302 million municipal (non-education) budget. In 2009, it went down to $57 million, and in 2010, the city still expected to see $49 million, but got $29 million instead. Over two short years, the state cut 10% of the Providence budget, and each time it happened well after the fiscal year was underway. But it’s fashionable to blame David Cicilline for Providence’s fiscal crisis, so apparently there’s no point in asking Governor Carcieri or any of the Assembly leadership what made them think the municipal budgets could withstand this kind of abuse without cracking.

Here’s the part that makes it all a bit worse. A lot of the aid cut technically did not go to the city or town itself, but to you. In the fall of 2009, towns expected $133 million of state aid to reduce the property tax on your car in fiscal 2010. The state was paying a portion of your taxes for you. The towns only got half of that, and almost all the rest was cut for fiscal 2011. Essentialy, the state was telling the cities and towns to make up the difference from property taxes on cars—now! Some did send out new car tax bills, but many just sucked it up and made cuts.

You see a lot of people wringing their hands about Rhode Island’s municipal fiscal crisis—How will we pay for all those retirees? What were those Mayors thinking? Can you believe those unions?—but how often do you see the story of the state budget included in the saga?

When I describe this sequence of events to people, they will point out that state revenues plunged in 2009, so the state had no choice. But this is an absurd position to take. After all, during each year of these huge municipal aid cuts, Rhode Island was increasing the amount of a generous tax cut granted to the richest taxpayers in the state. That is, taxes were cut further each year at the same time aid was slashed to all the cities and towns. Governor Carcieri and Assembly leaders felt that lower taxes on rich people were important enough to slash aid to  cities and towns—a position they still hold.

Next: Education (really)

Budgeting for Disaster – Part II


Deprecated: Function get_magic_quotes_gpc() is deprecated in /hermes/bosnacweb08/bosnacweb08bf/b1577/ipg.rifuturecom/RIFutureNew/wp-includes/formatting.php on line 4387

Deprecated: Function get_magic_quotes_gpc() is deprecated in /hermes/bosnacweb08/bosnacweb08bf/b1577/ipg.rifuturecom/RIFutureNew/wp-includes/formatting.php on line 4387
Growth of the state budget over the past 20 years. Looks scary, no?

Growth of the state budget over the past 20 years. Looks scary, no?

Look at it grow

So what’s in the state budget? Funny you should ask. In the accompanying chart, you can see the breakout in a graph prepared by the House Fiscal staff. They publish a digest of the budget every year that is pretty helpful in figuring out what’s going on. What you can also see from the graph is how the budget has grown in 20 years.

What you see looks like huge growth, and if you compare it to the inflation rate over those 20 years, it seems to confirm what everyone says, that government spending is out of control and so on. You know how that song goes.

In fact, there are some serious problems in government spending, but they’re pretty specific and we’ll get to them. But first, let’s talk about inflation. The inflation rate is calculated based on a household’s expenses, and it looks at the rise in prices of the things that people buy: groceries, gasoline, auto insurance, medical services, TVs, washing machines, and so on. Your state government does not actually buy a lot of groceries, and I’m betting that you do not buy a lot of services from corrections officers or park rangers. That is, there’s no reason to think that the inflation rate tells you anything useful about how much government spending should grow.

What’s really at issue in questions like this is whether the taxes the state levies are weighing down the state’s economy. If taxes are soaking up a bigger proportion of the state’s economy than 20 years ago, that’s not good news unless we’re getting a lot more services. So what’s the story?

In 1992, the state collected $1.74 billion in taxes, and the state’s economy (measured by personal income reported by the BEA) was about $21.1 billion. So the state collected taxes equal to 8.25% of the overall economy. Using the 2011 BEA income number and the economic predictions in the budget [on budget page ES-13] we expect personal income in 2013 to be about $49.7 billion, out of which the Governor’s budget will pull $3.27 billion in taxes, or 6.6%, or nearly one-fifth less than in 1992.

Ok, you say, but property taxes have taken up the slack, right? In 1992, RI cities and towns collected $990 million in property taxes, meaning that state and local taxes together were around 12.9% of the state’s economy. I don’t know what property taxes will be in 2013, but they added up to $2.11 billion in 2011. In order for them to get up to the 1992 proportion of the overall economy, property taxes will have to jump by 48% from their 2011 levels. They went up a lot last year, but no city or town’s taxes went up nearly that much.

In other words, no matter how you slice it, state and local taxes are taking up a smaller share of the state’s economy today than 20 years ago. Maybe it’s hard to believe, but it’s true: the biggest reason we’re getting less government these days is because we’re paying less for it relative to the size of the economy. If state and local taxes added up to the same proportion of our economy in 2013 as in 1992, the state and cities and towns would have an additional $900 million dollars in revenue each year, far more than the deficits of the state and all the cities and towns put together. I’m not saying that this is the right measure, but it’s not possible to argue successfully that the gross level of state and local taxes we have now is slowing the state’s economy.

Again, I know this is hard to believe, but in reality there is a specific reason why it’s hard to believe, and there are ways in which our taxes are slowing our economy.  You just can’t see it in the broad averages. We’ll get to that down the road, when we get to a detailed picture of taxes. For now, I’m going to stay on spending, and focus on the makeup of the bars in the graph next.

Assistance, Grants, and Benefits (really)

The legend is a little hard to read, but the yellow at the bottom of each column is personnel expenses (which includes benefits), and moving up, you have good old “Other”, followed by aid to local governments, “Assistance, Grants and Benefits”, capital expenses, debt service, and operating transfers. Let’s look at the big ones here.

Starting again from the bottom you have personnel expenses. This includes the infamous pension payments, which have gone up a lot since 1992, but have been pretty well matched by the rise in health benefit costs. For 2013, the pension payments will be about $167 million, and health benefits $183 million [ES-32]. The 1992 payroll included a bit more than 16,000 state employees (on paper). As of now, there are 13,700 employees, almost 1,000 fewer than are officially in the budget.

What about salaries? This is a little harder. You see, until recently, the budgets were silent about how many positions were actually filled. You’d see that 16,000 employees (full-time equivalents) were approved for the budget, and that’s all it would say. But some positions hadn’t been filled for years, and lots of unfilled positions had no money appropriated for them. If you take a strict apples-to-apples comparison, you get that the average annual wage of a state employee in 1992 was about $37,000, and in 2012, it was $61,300. It turns out that this is pretty much exactly the rate of inflation for those years. On paper, at least, salaries have risen slower than the budget as a whole. It’s not possible from the public documents to say how many positions were filled in 1992 (though maybe a reader will have that number for me). But you can say that wage growth is absolutely not driving the budget’s growth.

Moving up to the purple band, you have the aid to local governments. The bulk of this is education aid, scheduled to be $674 million in 2013 [ES Appendix D]. This is a big number, and quite big enough to mask the devastating cuts to aid to the non-education parts of local government in 2008-2011. In 2008, the state appropriated $244 million for aid to municipal governments. In 2011, that number was $60 million [ES Appendix C]. Education aid was cut during those years, too, but not nearly as much. Are you still wondering why municipal governments are struggling to stay above water? You can sort of see this decrease in the 2008-2011 columns, but the presentation doesn’t make it very clear.

The blue band above the purple is the one that excites the most attention. This is “Assistance, Grants, and Benefits.” It sounds like it means welfare, but it’s just an accounting category, and covers everything from Medicaid to the money the state library gives to the Historical Society to maintain the collection of battle flags in the state house atrium, the silver tea service from the USS Rhode Island, and the other artifacts they keep for us. It also includes student aid at URI, unemployment insurance, TDI payments, and more.

The big bulk of this chunk is Medicaid, at $1.66 billion [B2-12 and B2-118 for previous years]. It is probably the fastest growing chunk of this category, too, but it’s not easy to be sure from the documents. Less than half of it is actually health care to poor people. Most of the rest is care for the disabled and elderly. The state pays approximately 48% of the cost, and federal dollars cover the other 52%.

Here’s the point I can’t help see in this graph: The biggest cost driver in the three biggest parts of the budget is health care. It’s more than 10% of personnel costs, it’s part of what cities and towns use state aid to pay for, and it’s far and away the biggest part of the Grants and Benefits layer. If you really want to find the reasons why the state is spending as much as it is and seems like it’s getting less than in 1992, the cost of health care is impossible to ignore.

And yes, you could solve the budget problem by cutting health care out of the budget—slash employee benefits, and all benefits to poor people, wheel the old people and disabled out of their group homes and down to the curb. That might keep health care costs from bankrupting the state, but it won’t keep it from bankrupting all the rest of us. If there ever was a case for government malpractice, it can be found in the utter silence of Lincoln Almond and Don Carcieri when it came to addressing this problem.

Next: Municipal Budgets
Full Series: Budgeting for Disaster

Budgeting for Disaster – Part I


Deprecated: Function get_magic_quotes_gpc() is deprecated in /hermes/bosnacweb08/bosnacweb08bf/b1577/ipg.rifuturecom/RIFutureNew/wp-includes/formatting.php on line 4387

Deprecated: Function get_magic_quotes_gpc() is deprecated in /hermes/bosnacweb08/bosnacweb08bf/b1577/ipg.rifuturecom/RIFutureNew/wp-includes/formatting.php on line 4387
FY2013 budget

FY2013 budgetOne of the problems of political journalism is trying to parse the difference between what’s really going on and what is said about it. Press releases are misleading as often as they are informative, and interviews seldom get at any matters beyond the superficial.

That’s the secret pleasure behind budget analysis. A budget document is the policy choices of the government made manifest. You don’t have to ask someone what the policy is, it’s there in the sums. There are, of course, ways to obscure policy within a budget, and not all budgets are presented well, but these problems pale before trying to decipher what some people mean when they talk about policy issues. What does it mean to “cut” a program? What does “level funding” mean? Is some program really “new?”

The problem with open government is that sometimes there is altogether too much information available. You can go to the RI Open Government site now and learn how much any department spent on postage last month. That’s fine, but once you know that, what do you really know? The state budget is something similar. The budget documents for the state of Rhode Island are a large and ungainly set of documents. They are seven volumes, and even the Executive Summary has a hundred pages, plus five appendices. It’s hard to know where to begin.

Here, then, is the beginning of an entirely desultory tour through the state budget—and the state budget documents. For the next several weeks, I’ll post an article every few days (and every Monday) about different parts of the budget, and eventually we should be able to get within shouting distance of most of it. Obviously some subjects will get short shrift, but there will be room to cover plenty of the controversies. I’ll monitor the comments for suggestions, directions, and corrections, and will happily accept them via email as well.

Through the same period, the House Finance Committee will be conducting hearings about the various pieces of the budget proposal, but they are unlikely to do anything about any of it until after the beginning of May, when the estimates come in for tax receipts and social service expenses.

Volumes

The budget documents have been rearranged slightly this year, and they consist of the following volumes (and my abbreviations).  All these are available at the link above:

  • Executive Summary (ES) contains text descriptions of the budget and its changes. It also has a description of the economic outlook, summary schedules, tables of municipal aid and education aid, and the planning values used.
  • Budget, volume I (B1) contains the budget for the General Goverment departments, like Administration and the Legislature, and the quasi-public agencies like RIPTA and the Airport.
  • Budget, volume II (B2) has all the Human Services agencies (Health, DCYF, and Behavioral Healthcare, Developmental Disabilities and Hospitals, and so on)
  • Budget, volume III (B3) covers all the Education departments, both Elementary and Secondary, and the state higher education institutions.
  • Budget, volume IV (B4) is for Public Safety, Transportation, and Natural Resources.
  • Capital Budget (C) has all kinds of exciting tables about how much is borrowed and what for.
  • The Technical Appendix (TA) is where dollar figures for detailed accounts are published, and includes the accounting codes, which helps when you want to get specific answers later.
  • There’s usually a small Budget as Enacted document that toddles along a month or so after the budget is passed. It’s not much more than a restatement of the schedules in the various department budgets; its numbers become part of the next year’s presentation.

In addition to these, the word “Budget” can also refer to the Appropriations Act itself. This is the law that actually gets passed by the legislature and signed by the Governor, and this year it’s been introduced to the House as bill 2012-H7323. All the numbers presented in the seven volumes are in Article 1, and the other articles contain the necessary legal changes to make the numbers work. Of course, the budget is a must-pass piece of legislation, so by the time the budget hits the floor of the House for debate, the articles will often include some hidden delights, too.

So let’s begin.

Austerity

To begin with, let it be clear from the outset that this is an austerity budget. Governor Chafee is getting lots of flack from the usual sources about his high spending and his tax increases, blah blah blah. What these people don’t want you to know is that this is a budget with many savage cuts in it. Chafee claims $45 million in program cuts in his transmission letter (beginning of ES), and the overall budget is down by 2.8%, to $7.943 billion from $8.173 billion in FY12. Federal funds are to be cut $271 million, largely due to the expiration of the stimulus funds.

For a little perspective, the state’s economy is expected to be a hair less than $50 billion in 2012, so the state budget is about 16% of everything. Municipal expenses add another $2 billion or so, so together we’re talking about a fifth of the state economy under very tight constraint. Recovery from our downturn can happen under these circumstances, but the austerity we’re seeing in government is roughly the opposite of stimulus, so it’s not as if the state is helping dig the economy out of its hole.

Why is the Governor’s budget so stingy? Because the Legislature told him that’s what they wanted. Last year, Governor Chafee proposed some changes in the sales tax to give his budget a modestly expansionary flavor. The state has to balance its budget, so we can’t do wholesale stimulus; the idea was only to keep from slashing everything, and to prevent a situation where government was laying people off during a recession. Any tax at all, of course, was anathema to the business “community” and the legislature duly shot it down, in peremptory fashion. House Speaker Gordon Fox essentially foreclosed the tax change before the budget even got to the behind-closed-door phase. So most towns enacted a property tax increase, and this year we have more austerity and cities going bankrupt. It’s really a pretty simple connection, even though lots of people want you to think it’s complex.

You have likely already heard lots of righteous-sounding arguments about how we ought to balance the government’s checkbook just like we balance a household’s. The analogy hides that fact that the austerity we feel is self-imposed, with much of it due to ill-advised tax cuts in the recent past.  Second, and more important, it would have us imagine that paving roads, jailing criminals, and providing universal public education is somehow comparable to buying groceries and paying rent. Yes, the accounting can be made to look similar, but does the analogy stretch any further than that? The benefit of my groceries goes to me. The benefit of public education and roads doesn’t accrue to the state government in any but the most indirect sense. There is a difference between public goods and private ones that the accounting cannot reach and that many fiscal “conservatives” apparently cannot see. But more about all of this further down the road.

Next: “Assistance, Grants, and Benefits” — 44.6% of the budget?

Inventing the Internet


Deprecated: Function get_magic_quotes_gpc() is deprecated in /hermes/bosnacweb08/bosnacweb08bf/b1577/ipg.rifuturecom/RIFutureNew/wp-includes/formatting.php on line 4387

Deprecated: Function get_magic_quotes_gpc() is deprecated in /hermes/bosnacweb08/bosnacweb08bf/b1577/ipg.rifuturecom/RIFutureNew/wp-includes/formatting.php on line 4387
What goes around goes around.

What goes around goes around.I attended a fascinating conference last week in DC, the 20th anniversary celebration of the National Information Technology Research and Development program (NITRD), a 15-agency cooperative mission launched in 1992 to coordinate federal R&D around information technology.  Funded as a consequence of the 1991 High-Performance Computing Act (a/k/a the “Gore Bill”), this was the funding that created the backbones of the internet, and persuaded the admins of ARPAnet and NSFnet and the other smaller networks to join in creating the single internet that we know today.

There were a bunch of interesting points passed along by the various speakers, too many to cover, but here are some highlights:

  • From Tom Lange, the director of Modeling and Simulation R&D at Proctor and Gamble, we learned about the challenges of creating computer models of the flow and absorption of non-newtonian fluids on a porous substrate, and why that’s important to the design of Pampers.  P&G apparently funds research at Los Alamos and Argonne national labs, among others.
  • From Sebastian Thrun, a scientist at Stanford and Google, we saw videos of automated cars negotiating Lombard Street in San Francisco and one-and-a-half-lane mountain roads with oncoming trucks.  He says that in 250,000 miles logged on California roads, they have had only one accident, when the car was rear-ended as it stopped at a red light.
  • From Kevin Knight, a researcher at USC, we heard about the limits of machine translation and how statistical language analysis can make increasingly good translations of text from one language to another even if it still can’t tell you what the text was about.

These were all fun, but there were two big points made that have to be passed along, too.  One is the phenomenal return we’ve seen on government investment in this science (and many others, but the conference wasn’t about them).  Samuel Morse’s development of the telegraph was supported by government funding, and so was virtually every aspect of the internet, computers, mobile devices, and communication technologies that have changed all of our lives over the past 20 years.

We take the internet for granted, but there is no sensible reason to do so.  The people who made the decisions to make it possible were not corporate buccaneers or rich investors.  The necessary investments to make it possible were too risky and too large for the private sector to take on.  So the government did.  They managed to find private partners to manage important parts of the result, but to imagine it would have happened without government is to live in a fantasy world.  Fortunately, your government hadn’t yet been so defanged in 1991 that it couldn’t envision something ambitious (and equally fortunately, George Bush Sr. was persuaded to support it).  One speaker said, after accounting for the economic impact of NITRD, “not bad for a bunch of faceless government bureaucrats,” and everyone laughed.

There’s a train station opening up near my house soon.  Driving by it recently, I thought about how much I am looking forward to its opening and how seldom I get a chance to express some pride in the workings of our government.  The people who imagine that government can do no good have had the upper hand in our politics for the past 30 years.  Even when Democrats hold office, discussions of what government can do is dominated by the limitations in resources imposed by the starvation resulting from decades of tax cuts to rich people.  Our ambition to use government to improve our lives has been squeezed out of public discussion.  But here it is in 2012, you are reading this text electronically.  While you thank one of those faceless government bureaucrats for that improvement in your life, you might also wonder what equally astonishing innovations have been squeezed out of your future by the fashionable austerity that rules our days in 2012.


What’s the other important point to make?  Vint Cerf and Bob Kahn were at the conference, too.  Together, they invented TCP/IP, the communication protocol that makes all this internetworking possible, and not a few other communication innovations along the way.  Cerf introduced Al Gore, who gave the keynote address after lunch, and pointed out three or four different ways the internet might not have happened at all without intervention, support, and initiative from the geeky Congressman and then Senator from Tennessee.  Aside from the Gore Bill itself, Cerf recounted a hearing in 1986 about the national supercomputing centers, then a half-dozen or so universities and research institutions around the country with supercomputing facilities.  At the hearing Senator Gore asked, “Would it be a good idea to link the supercomputing facilities with a fiber-optic network?”  According to Cerf, the question took everyone by surprise, but it resulted in a three-day meeting in California six months later where they decided the answer was “yes.”  So that’s the other point: the next time you hear an Al Gore joke about the internet, know that you’re listening to someone who was taken in by press malfeasance in 2000.

How did that joke really happen?  It sounds ridiculous, but this is how: Gore made a completely accurate claim in an interview with Wolf Blitzer on CNN and a few days later, Michelle Mittelstadt of the Associated Press restated it for him, exaggerating his meaning.  The restatement was restated again by Lou Dobbs on CNN, with some flourishes stolen from a press release by Jim Nicholson, the Republican National Committee chair.  That was repeated and further embroidered by the press many zillion times, sometimes mindlessly and sometimes maliciously, and the result was that Al Gore lost that election — the imagination reels — and I have a joke that can make you click on this post.  Isn’t history fascinating?

Lock-em-up-unless-they’re-bankers Kilmartin


Deprecated: Function get_magic_quotes_gpc() is deprecated in /hermes/bosnacweb08/bosnacweb08bf/b1577/ipg.rifuturecom/RIFutureNew/wp-includes/formatting.php on line 4387

Deprecated: Function get_magic_quotes_gpc() is deprecated in /hermes/bosnacweb08/bosnacweb08bf/b1577/ipg.rifuturecom/RIFutureNew/wp-includes/formatting.php on line 4387

Striking a vital blow against accountability, Attorney General Peter Kilmartin endorsed the “50-state” settlement on foreclosure fraud yesterday, led by the Iowa Attorney General, Tom Miller. The settlement essentially allows banks to skip away from the crimes they committed in the course of foreclosing on a few million people’s houses.

To recap: this settlement has been over a year in the making, and is intended to clean things up in the real estate market, absolving banks of responsibility for their misdeeds in exchange for money that will go to principal reduction, and also doing some short sales and refinancing and payoffs to unjustly foreclosed borrowers.  These are good things, but there is a problem.

Nationally, we’re talking about $25 billion, which sounds like a lot, but last year JP Morgan’s bonus pool was around $10 billion. HUD Secretary Shaun Donovan says there is about $700 billion in negative equity in the country. Realistically, the program might help a million people, but there are 10.7 million mortgages underwater, and millions of people already foreclosed upon, also according to HUD.

Not only is the money not commensurate with the damage they caused, but it’s not going to be much help cleaning up, either. Kilmartin estimated Rhode Island would see “millions” from the settlement. The registrar of Essex County, Massachusetts, hardly the epicenter of the foreclosure epidemic, estimated last year that only 16% of the mortgages in his registry were valid, and of the rest, 27% were fraudulent. Over the past decade, the RI real estate market has been around $5 billion per year. Roughly similar numbers for the state of Rhode Island would have around a billion dollars in fraudulent mortgages per year, or around $8-10 billion total, give or take.  It will take a lot more than a few million to clear all those titles and restore the damage done.

Why is the settlement so low?  Maybe it’s because there hasn’t, until recently, been even a credible threat of prosecution for the crimes committed.  Just to review, we’re talking about actual crimes — fraud, forgery, perjury — acts for which you or I would spend time in jail.

What’s also astonishing here is where this $25 billion will come from. It turns out that almost all of it will come from the owners of the securitized mortgages, the pension funds and other investors who bought these terrible bonds from the banks.  Those owners will be dinged some of their interest payments, making their bonds even less valuable then they already are.  It appears that most of the money will not come from the banks that caused the problem and profited so much from it. So much for even the simulacrum of accountability.

For everyone who thinks, “Oh, well, the banks were just foreclosing on people who didn’t pay their mortgage, anyway,” there is a big problem ahead. The bank’s self-invented mortgage registry (MERS) was not maintained, and was probably inadequate to the job it was assigned: keeping track of ownership. (Not to mention that it was probably an illegal enterprise in the first place, but put that aside for a moment.)  This means that pretty much any property whose mortgage passed through MERS won’t be able to get a clear title. In turn this means a lot of claims on the title insurance companies, some of whom are likely to go under because of the mounting pile of claims. It also means time spent in court by people who can’t get a clear title to the property they own and money spent on lawyers to argue about them. Years from now, when you find yourself shelling out a few thousand dollars to clear the title to your house, you can comfort yourself in knowing that not only did none of the people who caused that problem have to pay any price at all, but most of them got rich doing it.  What a country!


Deprecated: Function get_magic_quotes_gpc() is deprecated in /hermes/bosnacweb08/bosnacweb08bf/b1577/ipg.rifuturecom/RIFutureNew/wp-includes/formatting.php on line 4387