Talking about end-of-life options in Rhode Island


Deprecated: Function get_magic_quotes_gpc() is deprecated in /hermes/bosnacweb08/bosnacweb08bf/b1577/ipg.rifuturecom/RIFutureNew/wp-includes/formatting.php on line 4387

Deprecated: Function get_magic_quotes_gpc() is deprecated in /hermes/bosnacweb08/bosnacweb08bf/b1577/ipg.rifuturecom/RIFutureNew/wp-includes/formatting.php on line 4387
Tim Appleton
Tim Appleton

Tim Appleton, campaign manager at Compassion and Choices, was talking to a full room about “medical aid-in-dying.” This would take the form of legislation that would allow a terminally ill, mentally capable person with a medical prognosis of six months or less to obtain and, if their suffering becomes unbearable, self-administer medication that brings about a peaceful death.

This is presently the law in five states: Oregon, Washington, Montana, Vermont and California. One in seven Americans currently have this option available. In Rhode Island, if a person wanted this option, their best bet would be to establish legal residency in Vermont. Obviously, this is not something that everyone can do.

Compassion and ChoicesLast year, the Lila Manfield Sapinsley Compassionate Care Act, introduced in the State Senate by Gayle Goldin and in the House by Edith Ajello, died in committees. Whether or not the legislation will be reintroduced this year is an open question. What the legislation needs is a group of passionate supporters ready for a multiyear effort at the State House to make this happen.

Last year the Catholic Church and some members of the disabled community spoke out against the bill. The opposition from the Catholic Church is to be expected. Across the country the Church has spent millions of dollars defeating similar legislation in other states, mostly by telling stories about people being coerced into taking their lives. For the disabled community these stories of misuse and coercion are serious concerns, but Appleton is clear that in the United States, where this idea has been law for nearly two decades, there has “not been a single case of abuse, misuse or coercion.”

Opponents present a false choice between hospice care and aid in dying, but in reality the two ideas are complimentary. Hospice works to manage pain through the process of dying, while this legislation allows the option of ending one’s life in the event the suffering becomes unbearable. This brings a sense of comfort and control to a terrible situation.

The simple fact is that any one of us may one day be in the position of wanting to end our life in the event of a terminal, painful illness, or we may be the caretaker of a loved one suffering through the process. Each of us confronts the end of our lives differently, and this option is not for everyone.

As Governor Jerry Brown said, when he signed California’s act into law, “I do not know what I would do if I were dying in prolonged and excruciating pain. I am certain, however, that it would be a comfort to be able to consider the options afforded by this bill. And I wouldn’t deny that right to others.”

Patreon

New standards set for health insurance providers


Deprecated: Function get_magic_quotes_gpc() is deprecated in /hermes/bosnacweb08/bosnacweb08bf/b1577/ipg.rifuturecom/RIFutureNew/wp-includes/formatting.php on line 4387

Deprecated: Function get_magic_quotes_gpc() is deprecated in /hermes/bosnacweb08/bosnacweb08bf/b1577/ipg.rifuturecom/RIFutureNew/wp-includes/formatting.php on line 4387
Commercial health insurers in Rhode Island will need to have 50 percent of their payments based on quality by 2018 under a new plan announced by the Office of the Health Insurance Commissioner (OHIC) Thursday.
Shared goals between public and private payers are seen as crucial to the success of healthcare reform efforts. The Alternative Payment Methodology Plan is meant to further align commercial insurance payments with those of public payers-Medicare, and the state’s nationally recognized reinvented Medicaid program.
Beginning in 2017, commercial health insurers will be required to direct 40 percent of medical payments through quality and efficiency-based payment models, increasing to 50 percent in 2018.
Along with the alternative payments plan, OHIC also released this year’s Care Transformation Plan, which requires insurers to continue to grow and support patient-centered medical homes.
This all comes out of OHIC’s Affordability Standards, which were first established in 2009 by then-commissioner Chris Koller. Under the direction of the current Commissioner, Dr. Kathleen Hittner, OHIC updated and enhanced the Affordability Standards last summer following a year-long public review and input process.
Included in the new Standards was the establishment of two advisory committees charged with developing yearly plans to reach long-term goals. The Alternative Payment Methodologies Committee is focused on shifting from the old fee-for-service model to payments based on quality and value rather than volume; and the Primary care Transformation Advisory Committee deals with supporting the development of primary care infrastructure and coordinated, high-quality, patient-centered care.
As is usually the case in the Rhode Island health policy world, these advisory committees featured a diverse group of stakeholders. Representatives from the carriers, provider and hospital groups, the employer community, and consumer advocacy organizations were at the table. With support from OHIC staff, they crafted the plans announced yesterday which will guide commercial payers for the next year. Both committees will reconvene in the Fall.

Democratic Providence School Board chair endorses Republican for president


Deprecated: Function get_magic_quotes_gpc() is deprecated in /hermes/bosnacweb08/bosnacweb08bf/b1577/ipg.rifuturecom/RIFutureNew/wp-includes/formatting.php on line 4387

Deprecated: Function get_magic_quotes_gpc() is deprecated in /hermes/bosnacweb08/bosnacweb08bf/b1577/ipg.rifuturecom/RIFutureNew/wp-includes/formatting.php on line 4387
John Kasich?
John Kasich

In a succinct statement posted to Facebook, Providence Democratic School Board Chair Nicholas Hemond announced his endorsement of Republican Ohio Governor John Kasich, writing, “John Kasich should be president of the United States.”  In an email, Hemond elaborated, saying, “I just appreciate the guy’s measured tone in a race that has been such a circus.”  Pointing to a policy of staying out of national races, Hemond clarified that he will not be taking any formal role in Kasich’s campaign.

Frequently portrayed as a member of the establishment wing of the Republican Party, Kasich is known for his fierce advocacy for restricting workers’ rights and defunding Planned Parenthood.  Kasich finished second in the New Hampshire Republican primaries.

Hemond is a controversial figure in Providence politics. Working at the Darrow Everett law firm, Hemond has emerged as the go to lobbyist for developers looking for special deals to lower their tax rates.  He recently suffered a major defeat when a tax break extension was defeated, due to pointed opposition from Council President Luís Aponte and Majority Leader Kevin Jackson, the leaders of the all-Democratic Providence City Council.  While advocating for these subsidies for big developers, Hemond opposed then-Chair Keith Oliveira’s proposal to increase the school budget, instead voting for Mayor Jorge Elorza’s lower proposal.  In January, Oliveira resigned in protest, blasting Mayor Jorge Elorza for his education policies and leadership approach.  With Elorza’s support, Hemond replaced Oliveira as Chair.

Providence is a strongly Democratic city, backing President Obama over Mitt Romney by a seventy-point margin.  Every elected official in Providence is a Democrat.  Hemond is also a registered Democrat, and he is thought to harbor ambitions of running for Mayor as a Democrat.

Moira Walsh to challenge Palangio in House District 3


Deprecated: Function get_magic_quotes_gpc() is deprecated in /hermes/bosnacweb08/bosnacweb08bf/b1577/ipg.rifuturecom/RIFutureNew/wp-includes/formatting.php on line 4387

Deprecated: Function get_magic_quotes_gpc() is deprecated in /hermes/bosnacweb08/bosnacweb08bf/b1577/ipg.rifuturecom/RIFutureNew/wp-includes/formatting.php on line 4387
Moira Walsh and Malcolm

Moira Walsh announced her candidacy for State Representative in House District 3, including the Smith Hill, Charles and Wanskuck neighborhoods in Providence.

“I was born and raised in Smith Hill, and I love our neighborhood,” said Walsh, who in addition to being a longtime waitress in Providence also works as a community organizer with Rhode Island Jobs with Justice. “I’m running for State Representative because our district needs someone who will give everything she’s got, every day, to fight for our community. I know I have the energy, persistence, and passion to follow through on that commitment – because our community deserves it.”

Walsh cited her strong family roots in the district as pivotal in her decision to run for office. “My first job growing up was at The Earthen Vessel, my father Michael’s cornerstone on Smith Hill that offered everything from refrigerators to school uniforms at prices our neighbors could actually afford,” she said. “My mother, Janet, worked for the Diocese of Providence and taught CCD at local parishes for more than two decades. My parents – who still live on Violet Street – always fought tirelessly to support their kids and better their community, and they instilled those same values in me.”

A parent herself, Walsh says her experiences as a single mother gives her the right perspective to represent working families in the district. “As a single mother, I have experienced what so many struggling families in our community deal with on a daily basis,” she said. “I know what it means to choose between paying for gas or for electricity. To decide between buying groceries or getting clothing for my son. I understand what it feels like to work full time, to sign up for all the extra shifts you possibly can, and still fall short at the end of the month. People in our community are working eighty hours a week and spending no time with their families, just to keep their heads above water. It seems that no matter how hard we try, the system is rigged against us, and no one is fighting to preserve the community that has given us all so much. That is why I have worked to advocate for increases in the minimum wage, for protections for workers, and that’s why I’m running.”

Walsh’s candidacy was greeted with excitement across the district. Thomas Oliveira, who have lived in the area for many years, said, “I am so glad Moira is running for state representative. She understands the importance of supporting the community and local businesses, after all, her dad had one that meant a lot to the neighborhood. I know that she has the energy, honesty and commitment to make our neighborhood a better place.”

Janice Luongo, longtime community organizer and Smith Hill resident is also excited. “There is a lot of need in our community,” she said. “And we need someone like Moira who will listen and take action because many families are struggling.  Moira understands struggle, but she also knows how to bring people together to get things done. She has always lived in and loved this district, and I can’t think of anyone better to fight for the issues that matter to us at the State House.”

Walsh lives off of Douglas Avenue in the Wanskuck neighborhood of Providence with her 2 year-old son, Malcolm. She is an alum of Classical High School and Rhode Island College, a longtime server at a local Providence diner, and an organizer with RI Jobs with Justice.

[From a press release]

[Editor’s note: Walsh will be running against Rep Thomas A. Palangio (D) who was elected to 2012 and was re-elected in 2014.]

Lead poisoning in Rhode Island


Deprecated: Function get_magic_quotes_gpc() is deprecated in /hermes/bosnacweb08/bosnacweb08bf/b1577/ipg.rifuturecom/RIFutureNew/wp-includes/formatting.php on line 4387

Deprecated: Function get_magic_quotes_gpc() is deprecated in /hermes/bosnacweb08/bosnacweb08bf/b1577/ipg.rifuturecom/RIFutureNew/wp-includes/formatting.php on line 4387

[A version of this article was originally published by The College Hill Independent on February 12, 2016.]

435px-Symptoms_of_lead_poisoning_(raster)Several men huddled around a fire hydrant late on a recent winter night. They were workers with Providence Water, a state-regulated department of the City of Providence that provides the capital with its water supply. They were flushing the main, the large pipe that runs down the center of a street, by releasing a high velocity stream of water from the hydrant. Over time, minerals from the water build up on the walls of the pipe, tightening its aperture and reducing flow and water quality. According to the workers, these flushes have nothing to do with lead.1  Providence, the workers were quick to point out, has the second best water in the country.

The claim that Providence has the second best water in the country used to appear on the homepage of Providence Water’s website, until it was removed sometime between October 16 and December 16, 2014. This despite the fact that in 2012, 2013, and 2014 the water consumers got from the tap exceeded the Environmental Protection Agency’s (EPA) lead action level, being the level of concern at which remedial measures are triggered under the Safe Drinking Water Act. Under the provisions of the Safe Drinking Water Act, the utility was required to distribute brochures notifying customers of elevated lead levels in all three years.

The most recent legally required notification of high lead levels was issued May 28 of last year. 2015 water quality data has not yet been released, but a spokesperson for Providence Water, Dyana Koelsch, told the Independent that “the latest testing shows that we do meet current regulations.” It is important to note, however, that meeting current regulations does not mean that the lead levels are below the EPA’s level of concern. For example, an excessively high lead level coupled with an informational brochure is fully in compliance with federal regulations without indicating that water lead levels are safe. As of the time of writing, water quality data had yet to be released.

But the tests that produce such data may be intentionally misleading. UK newspaper the Guardian recently exposed several US health departments for giving at-home water-testers instructions that would lead to systematically underreporting the amount of lead in tap water. The Rhode Island Department of Health allegedly instructed residents selected to participate in the testing to run their taps “until cold” before filling the sample bottles, a practice that reduces the amount of lead in the water and does not reflect the lead content of water that has been sitting in the pipes for several hours (like, for example, when you wake up in the morning).

Koelsch called the Guardian’s claim a “misunderstanding” and said that, while the utility would not go “tit-for-tat” with a newspaper, she conceded it would indirectly rebut the accusation by communicating “the truth.” Providence Water has not yet communicated a statement to the Independent, but has updated the section of their website dealing with lead at least three times between February 5 and 10. The old page, “Lead In Your Drinking Water,” has been replaced with “Reducing Lead Levels in Drinking Water,” and the link on the homepage now reads “Lead in Household Plumbing.” Providence Water has not placed dates on their statements. The most recent one (as of February 10) says, in part, “Our water meets or exceeds all Federal and State Safe Drinking Water Act Regulations.”


Despite lead being a highly regulated and tightly monitored neurotoxin, information about one’s personal risk from lead can be surprisingly difficult to get. Some Rhode Island buildings are certified as lead safe, but most aren’t. And some 80 percent of homes are thought to be older than 1978, the year lead paint was outlawed for home use, according to the Rhode Island Department of Health. Providence Water estimates that 20,000 homes in Providence are still serviced with lead pipes that run from the mainline in the center of the street to the sidewalk, where the homeowner’s piping begins. Federal law has required that Providence Water distribute brochures via mail informing residents of excessively high lead concentrations in the city overall, but doesn’t require that the utility distribute information detailing exactly where utility-owned lead service lines are used. Consequently, a system map is not available online. Customers may call the Lead Service Hotline or the Water Quality Hotline and inquire about a specific address, but it’s easy to imagine that many Providence residents do not know that they should be doing this. And information about pipe material isn’t widespread even among utility employees. None of the maintenance employees from that night knew what metal the service lines off the main they were flushing consisted of.And even if someone does know the material of the pipes, both in their service line and in their own plumbing, testing for lead in the water that comes out of the tap is done mostly by conscientious customers that are willing and able to pick up a lead testing kit and pay a $10 processing fee. Koelsch did say, however, “I’m sure if people can’t afford the $10 they’ll give [the test] to them.”

A recent report by the Environmental Justice League of Rhode Island shows that environmental toxins are predominantly concentrated in low-income and minority neighborhoods of Providence. This finding is supported by a 2010 study in the Maternal and Child Health Journal that demonstrates that lead poisoning is concentrated in Providence, Pawtucket, Central Falls, and Woonsocket, and in poorer and less white areas within each of those cities. In some suburban census blocks they found zero cases of lead poisoning between 1993 and 2005, compared to one urban census block where 48.6 percent of children were lead poisoned in that same time period.2 But local activists from organizations such as Childhood Lead Action Project and the Environmental Justice League of Rhode Island say the problem goes beyond the presence or absence of environmental health hazards in these neighborhoods. “We don’t live in a city and a state where everyone has the same power to act on the information that they may or may not have about lead hazards and other environmental hazards in their homes,” Laura Brion, Director of Community Organizing and Advocacy at the Childhood Lead Action Project, told the Independent.


Since federal and state legislation began targeting lead in the 1970s, the incidence of lead poisoning has steadily decreased in the United States, a fact that has lead some media outlets to call news coverage of the Flint, Michigan water crisis overdone. In the mid-1970s the Centers for Disease Control and Prevention (CDC) found that the average US child under the age of 5 had a blood lead level of 15 micrograms per deciliter. In context, the on-going crisis in Flint finds 4.9 percent of the city’s children with blood lead levels greater than or equal to 5 micrograms per deciliter, the amount of lead that the CDC defines as lead poisoning.

Rhode Island is one of the country’s worst states when it comes to lead poisoning. According to a 2010 study by Rebecca Renner published in Environmental Health Perspectives, the rate of children with elevated blood lead levels in Rhode Island is three times higher than the national average. Renner attributes this, among other things, to corrosive water that strips traces of metals from the pipes, to the fifth-oldest housing stock in the nation, and to the tens of thousands of Providence homes serviced with lead service lines.

“We also have issues, just like Flint, with lead pipes being used to bring our water to our homes,” Jesus Holguin, Youth Leadership Director at the Environmental Justice League of RI, told the Independent.  “There are similarities between Providence and Flint when talking about our Industrial past and the way these industries have all closed down and moved away, leaving a legacy of pollution in our communities. The right to clean air, clean water, and safe places for kids to play is something that wealthy communities take for granted. Many low-income and minority communities don’t get parks, street lights, housing code enforcement, or safe drinking water.” Koelsch, for Providence Water’s part, says that the utility “take[s] concerns from all their customers seriously, no matter what neighborhood they live in.”

Renner believes that the Rhode Island Department of Health downplays the correlation between lead in drinking water and lead poisoning among children, arguing instead that other environmental sources of lead are the prime drivers of lead poisoning. “When we see elevated blood levels, the typical sources are either paint, dust, or soil,” Joseph Wendelken of the Rhode Island Department of Health told the Independent when asked about Renner’s position. (For the record, Laura Brion agrees that paint, dust, and soil are more often the culprits behind elevated blood levels, but worries that the current flawed testing protocol means that we don’t really know what the scope of the lead-in-water problem is.)

Despite this worry, Rhode Island is making progress in the fight against lead poisoning. Data from the Department of Health show the prevalence of lead poisoning has decreased steadily from 34 percent of children in 2002 to 5 percent in 2014. “Rhode Island is still known, nationwide, as a lead poisoning hot spot,” says Brion. “We’re known as a lead poisoning hotspot that has done a lot to make the situation better, but we’re still not ahead of the pack.” The 2014 data indicate that about 1,000 children had elevated blood lead levels that year, according to calculations made by the Independent.  And for advocates, that number is still too high.

Every case of lead poisoning is preventable. The sources of lead are well-known and the mechanisms by which it enters the blood stream are non-controversial, even if the relative proportions to be attributed to water versus soil, dust, and paint are debated. That’s a big reason why these 1,000 lead poisoned children in Rhode Island represent a scandalous failure to public health advocates despite the fact that the figure is an improvement on ten years ago. And it’s why the situation in Flint is such an outrage to so many. Part of what is missed by those who call media coverage of Flint overdone is the fact that ‘better’ simply isn’t good enough when it comes to lead.

Critics of lead abatement policies point out that the blood lead level considered to be poisoning has been lowered over time by the CDC—most recently in 2012 it was lowered from ten to five micrograms per deciliter. State Representative Joseph Trillo (R–Warwick), speaking in 2014 against a tax increase on home sales that would have provided $2.3 million for lead paint abatements said, the state’s improvement in the lead poisoning rate “wasn’t enough for the lead paint people. So what did they want to do? We had reduced it from thirteen thousand kids ten years prior down to twelve hundred. Now it was going down so low they said we have to lower the standard of the blood level. And they did that… we’re putting a tax on the property owners to put money towards a problem that’s been solved.”

But there is no known safe concentration of lead in the blood, and negative health effects have been found with as little as two micrograms per deciliter. The dangers of even low levels of lead are well established and include risk of a variety of neurological and other disorders. Inadequate funding or political will behind lead paint abatement programs, home risk assessment programs, or upgrades to water systems, will continue to allow a certain amount of lead poisoning to happen. And since the victims are predominately poor and predominately Black and Latinx, a certain political tolerance for lead poisoning seems likely to persist despite the efforts of generally well-intentioned yet underfunded health departments like Rhode Island’s. “Although Providence has made a lot of good progress around lead,” Holguin says, “we still see disparities in who’s affected in terms of race and income.”

“When I look at Flint I’m just heartbroken on so many levels because I just know how possible it was to stop the disaster from ever happening,” Brion told the Independent. “Every child that has been lead poisoned has experienced a violent attack on their brain. And I don’t think that’s a dramatic way of putting it. It deserves that attention, that horror, and that respect. Our normal should be zero. Because it can be zero and because all children deserve that.”


1 Providence Water officials disagree, and tout the practice as part of their anti-lead efforts.

2 The paper does not make it clear whether that census block is in Providence, Pawtucket, Central Falls, Woonsocket, or Newport, which are statistically clustered together as the worst lead poisoning areas.

Will Providence continue to be a Northeast Corridor rail city?


Deprecated: Function get_magic_quotes_gpc() is deprecated in /hermes/bosnacweb08/bosnacweb08bf/b1577/ipg.rifuturecom/RIFutureNew/wp-includes/formatting.php on line 4387

Deprecated: Function get_magic_quotes_gpc() is deprecated in /hermes/bosnacweb08/bosnacweb08bf/b1577/ipg.rifuturecom/RIFutureNew/wp-includes/formatting.php on line 4387

amtrak pvdThe federal government is considering improvements and changes to train service along the Northeast Corridor rail line that could end up bypassing Providence in favor of Worcester. Here’s how:

“NEC FUTURE – a plan for rail investment for the Northeast Corridor,” sponsored by the Federal Railroad Administration (FRA), and as their title indicates, is a program to determine a long-term vision and investment program for the Northeast Corridor (NEC), and to provide a Tier 1 Environmental Impact Statement (EIS) and Service Development Plan (SDP) in 2016 in support of that vision. The FRA launched NEC FUTURE in February 2012.

February 16, 2016 will be the last day to make comments on the Tier 1 Draft EIS (DEIS) before NEC FUTURE prepares the final document.

Throughout the last few years there has been a series of public hearings and workshops in various cities situated along the NEC, including Providence, to gather information from the public and show direction and progress of the study and preparation for the EIS.

Summary of NEC FUTURE and the DEIS
NEC FUTURE has three alternatives, plus a no action alternative, for upgrades to the Northeast Corridor with a focus on developing or enhancing high-speed rail (HSR) service.

Alternate 1 – Proposes upgrades to the existing NEC route. Features include a new rail bypass to extend from Old Saybrook, CT to Kingston, RI to speed service by avoiding curvy sections of the NEC in eastern Connecticut. Also additional tracks are proposed at choke points along the length of the NEC and new rail tunnels in Baltimore and between New Jersey and New York.

Alternative 2 – Proposes multiple track segments from Washington through the New York area along with other improvements. In southern New England a new HSR route is proposed between New York and Boston from New Haven to Hartford to Providence.

Alternative 3 – Proposes a completely new track corridor between Washington and New York that would run roughly parallel the existing legacy NEC. North of the New York four potential combinations for new HSR routes that are suggested between New York and Boston:
3.1 Central CT-Hartford-Providence
3.2 Long Island-New Haven-Hartford-Providence
3.3 Long Island-New Haven-Hartford-Worcester
3.4 Central CT-Hartford-Worcester

As the NEC FUTURE process heads towards its conclusion, there seems to be more questions than answers.

Within NEC FUTURE’s Alternatives Report, NEC population and employment forecasts show serious discrepancies, as far as how metropolitan area population and employment are defined and counted.

The New Bedford area, but also the border cities and towns of Massachusetts, and some of Rhode Island’s population was left out of the Providence metropolitan area count. Springfield, which is 30-miles away and technically is its own distinct and separate metropolitan region (a Combined Statistical Area or CSA), was added to Hartford, where New Bedford, which is generally included in the Providence MSA (or Metropolitan Statistical Area) calculation, also 30-miles away but from Providence was left out.

Incorrect data from the DEIS Appendix – Alternatives Report (October 2015)
Population:

  • Providence 970,000
  • Hartford 1,800,000 (the separate CSA of Springfield is added to the Hartford count)

Employment:

  • Providence 426,000
  • Hartford 873,000

Actual U.S. Government data from Census Projections (2014) for Population and Bureau of Labor Statistics (November 2015) for Employment Statistics
Population:

  • Providence MSA 1,609,000
  • Hartford CSA 1,214,000
  • Worcester MSA 931,000
  • Springfield CSA 629,000

Employment:

  • Providence 649,000
  • Hartford 590,400
  • Springfield 395,000
  • Worcester 329,000
  • New Bedford 78,000.

What’s implied in the DEIS numbers is that Providence is equivalent to Worcester instead of Hartford. So, if Providence and Worcester are roughly the same (which they are not) why build a second HSR route (Alt 3.1 or 3.2) through Providence? 

A Worcester route (Alt 3.3 or 3.4) would offer faster high-speed trains between Boston and New York, but if such a route were created, the coastal NEC would effectively become secondary local tracks. Coincidentally, a series of diagrams in the Alternatives Report illustrates the NEC coastal route in southern New England not as even intermediate tracks, but as “local tracks.”

If billions are spent on a new HSR Hartford-Worcester alignment, it’s highly unlikely that much will be done to improve the NEC coastal route. How then would a proposed 160mph HSR coastal route be developed along already congested Metro North tracks west of New Haven or curvy track sections of eastern Connecticut?

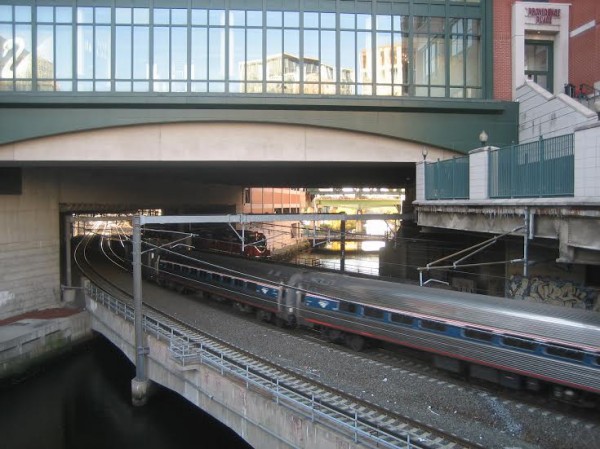
Today there are only two segments of the NEC north of New York in Rhode Island and Massachusetts that provide 150mph service.

There’s a huge difference in the quality of service that an inland 220mph route would provide compared to a 160mph coastal route. It’s not too difficult to imagine that if a new Danbury-Worcester NEC route were built that most people who want to travel between Boston and New York would use the inland route. The result for the coast would be the same slower service as today and likely a significant cut in the number of daily trains due to reduced ridership from the New Yorkers and Bostonians.

A 220mph inland route that went through Providence would have similar advantages as a 220mph inland route through Worcester for speed train service between Boston and New York.

In January a Providence Journal reporter, Patrick Anderson reached out to the FRA. When he asked about the population numbers used in the NEC FUTURE study, the FRA’s response was that they “acknowledged they didn’t use census figures, but Moody’s “market projections” because they wanted to use future numbers [and that] it was up to Moody’s what they included in each metro area.”

When he relayed this to me, it reminded me that a few years earlier at an NEC FUTURE public hearing that study staff members had mentioned that Moody’s Analytics was being used to supply data instead of using government figures, because they wanted to be “more accurate.”

So why is Moody’s data or numbers “future,” if the FRA is using Moody’s current numbers as the basis for determining future projections?  Why are Moody’s figures more “accurate” than the U.S. government’s?

In a letter responding to questions I had raised that a staff person at Congressman Cicilline’s office received from the FRA, claimed that the numbers were:

“different due to the source quoted (Census data projections from 2014) and boundaries used to calculate the population and employment numbers.  FRA’s data (obtained on a county-level basis for the Study Area) is based on Moody’s Analytics June 2013 “base” demographic forecasts. Moody’s data uses actual Census data (not the same as census projections) to make projections. Moody’s supplied three forecasts for the 2040 NEC population and employment projections based on this data: low, base (most likely), and high.

In addition, the geographic boundaries FRA used are not the same as the Metropolitan Statistical Area (MSA) boundaries cited by the constituent. The boundaries in the Tier 1 Draft EIS were drawn based on markets served and do not match up specifically to the MSA boundaries. For purposes of our analysis, the Providence and Hartford metro areas were defined as indicated below:

Providence (all of Rhode Island):
 Providence County, RI,   Bristol County, RI,   Newport County, RI,   Kent County, RI,   Washington County, RI

Hartford (also includes Springfield):
 Hampden County, MA,   Hampshire County, MA, Hartford County, CT,  Tolland County, CT,   Northern half of Middlesex County, CT

New Bedford (Bristol County, MA) is included in the Boston metro area”

If Moody’s “uses actual Census data,” which is “not the same as census projections,” the difference is miniscule.

Example:

  • 1,055,173             Rhode Island population (2014 census projection)
  • 1,052,931            Rhode Island population (2010 census)
  • 3,252                    Difference

If the FRA’s data is “obtained on a county-level basis for the Study Area” and the claim that Moody’s is using “all of Rhode Island[‘s]” five counties to determine the Providence area population, where did the figure of 970,000 in the Alternatives Report come from, that misses 80,000 from Rhode Island’s population?

Was Newport County or something else left out of Moody’s calculation for Rhode Island Why is it that “boundaries in the [DEIS] were drawn based on markets served and do not match up specifically to the MSA boundaries” and “New Bedford (Bristol County, MA) is included in the Boston metro area?”

FRA further stated to Congressman Cicilline’s office that:

“Alternative 3 in the Tier 1 Draft EIS includes four representative route options for a second spine between New York and Boston. All four options – two for service between New York and Hartford and two for service between Hartford and Boston – have been objectively evaluated in the Tier 1 Draft EIS.  Importantly, a second spine is intended to supplement the existing NEC, which would be brought to a state of good repair and expanded to accommodate 2040 demand. Thus, in any Alternative 3 route option the infrastructure and service on the existing NEC would be improved. 

Most importantly, FRA has not chosen a Preferred Alternative. The decision on the Preferred Alternative will be based on the findings presented in the Tier 1 Draft EIS, public and stakeholder comments, and FRA policy guidance.”

How is it possible for the FRA to make an “objective” choice in selecting a “Preferred Alternative,” if the data that’s the basis of the study, uses inaccurate population figures, which artificially exaggerate or bloat the Hartford metro area and deflate or mask the actual population of the Providence metro area.

Whether Moody’s, FRA, or NEC FUTURE wants to believe it or not, the Providence metropolitan area includes all of Rhode Island and Bristol County, MA, and has over 1.6-million people making it the second largest metropolitan are in New England after Boston.

Rhode Island and Bristol County, MA are economically and culturally intertwined.  Every day people cross the state line in both directions to work, attend school, shop, deliver goods, provide services, and attend cultural events. Members of families live on both sides of the state line.

It’s laughable to think that someone from New Bedford, who wanted to take Amtrak to Baltimore, would drive 60 miles north (in heavy traffic) to Boston instead of 30 miles west to Providence. As Moody’s defines it, Dartmouth or Westport, MA are “part of the Boston metro,” should medical helicopters with accident victims be redirected from the Rhode Island Hospital Trauma Center to Massachusetts General instead? Should the Providence/New Bedford TV stations be broken up, because Moody’s thinks Bristol County, MA is Boston?

Clearly Moody’s has misrepresented or misinterpreted the Providence metropolitan area geographic boundaries and population. With the FRA’s response to Patrick Anderson with its claim that they didn’t use census figures, contradicts with the response that Congressman’s Cicilline’s office received from an FRA insisting that Moody’s and the FRA used census figures instead of census projections.

What is the truth?

If Moody’s numbers stand uncorrected in the DEIS and the final EIS and the study process will not be credible, because it will be based on inaccurate and untrue data.  The Census and Bureau of Labor Statistics or other appropriate federal agencies or possibly a private company that offers similar services as Moody’s, should be directed by the FRA to conduct a peer review to independently verify Moody’s assumptions, methodology, and numbers, before the Final EIS is competed and issued.

By the time any of the projects outlined in the DEIS are funded, many government office holders likely will be out of office. What will remain is a faulty document based on bad numbers, which future leaders will base decisions on. Anyone who’s ever worked on an EIS knows that you try to include examples and data that best support your proposal or preferred project.

Alternative 3.4 looks very similar to earlier Amtrak proposals, which were published around 2010 of a Danbury-Hartford-Worcester and Danbury-Hartford-Woonsocket alignments. To my knowledge Amtrak has never shown a second HSR alignment in southern New England that goes through Providence, even though the FRA does with this NEC FUTURE study.

Has a Preferred Alternative already chosen and is the EIS being used to justify that choice with erroneous numbers?

Any mistakes or wrong assumptions in data provided to the FRA and NEC FUTURE made by Moody’s Analytics must either be corrected or replaced by U.S. government population, employment, and economic data, If not this study and resulting EIS will be skewed and questionable.

This discussion would be a non-issue, if Alternates 1, 2, or 3.1 or 3.2 were selected as Preferred Alternatives. However, if Alternatives 3.3 or 3.4 are selected and eventually built, the implications for the Providence area, the second largest metropolitan area in New England, as well as possibly the New Haven area would be extremely negative. This might be an over dramatization, but in effect Providence would become an outpost on the NEC, similar to the relationship that Syracuse or Rochester has with New York, as Providence would no long have its current advantage of being located on the (real) NEC, if a second HSR line is developed that bypasses the city.

Has slavery really ended?


Deprecated: Function get_magic_quotes_gpc() is deprecated in /hermes/bosnacweb08/bosnacweb08bf/b1577/ipg.rifuturecom/RIFutureNew/wp-includes/formatting.php on line 4387

Deprecated: Function get_magic_quotes_gpc() is deprecated in /hermes/bosnacweb08/bosnacweb08bf/b1577/ipg.rifuturecom/RIFutureNew/wp-includes/formatting.php on line 4387

“Churches can be a place where
judgment, shame and contempt
[for families with felons]
are felt most acutely.”
Michelle Alexander

Time for a pop quiz question. Ready? In what year did the U.S. end slavery?

Most agree it’s 1865. Some historians disagree. Their answer: 1942.

True, the Triangle Trade’s enrichment of slave shippers ended with the Civil War. Tragically, however, legally coerced work continued. Some southern states were sly. Police falsely imprisoned blacks, and judges ordered lengthy sentences at hard labor.

“Convict leasing” was legalized. Douglas Blackmon describes this practice as “a system in which armies of free men, guilty of no crimes and entitled by law to freedom, were compelled to labor without compensation, were repeatedly bought and sold, and were forced to do the bidding of white masters through the regular application of extraordinary physical coercion.”

The penal system became the new slavery.

th-43

Still, the answer to our black-history-month query may not be 1942. Ready for a shocker? Enslavement of blacks exists today.

The War on Drugs intensified in the 1980s. In just two decades, those jailed for drug offenses increased ninefold. The Director for National Drug Control Policy, retired General Barry McCaffrey, referred to this imprisonment system as a “drug gulag.”

Mass incarceration is aggressively focused on communities of color. Despite blacks and whites having similar drug usage rates, a 1999 Human Rights Watch report states, “Black men are admitted to state prison on drug charges at a rate that is 13.4 times greater than that of white men.” Indeed, black men imprisoned, on parole and probation now exceed all men enslaved in 1850.

Bondage for drug offenses is inflicted almost exclusively on black and brown men. Whites are usually ‘off the hook.’ Even when arrested, whites are more often given alternatives to jail. When jailed, whites’ average sentences are 16.3 percent shorter than blacks.

Enormous numbers of black bodies are placed in bondage, their prison labor extracted, for non-violent drug offenses. Isn’t this a new system of slavery? Isn’t this massive discrimination also subjecting prisoners’ families—parents, spouses and children—to excruciating emotional and financial bondage?

th-44

As a permanent undercaste, the black community also suffers wage slavery. Whites’ average household income is 68.5 percent higher than blacks—and the black unemployment rate is twice that of whites. This severely depressed income continually increases economic inequality: Average white families now have thirteen times the assets of average black families.

It gets worse: Black prisoners’ sentences continue after release.

Imagine leaving prison. Determined to lead a good life, you plan to go to college—but you’re barred from getting a federal loan. Or you need a job but, if a black man, only five percent of employers will even grant you an interview. You may be desperate for public housing assistance. You can’t get it. By law, you probably can’t receive any public benefits—including food stamps if your kids are hungry. With all these cruel barriers, what choices remain? Can we see why ex-cons often return to prison?

Again, this discrimination primarily decimates blacks.

rejection_zpsa13d9f5c

So who should correct these many forms of racialized financial rape? Why not the white community which perpetrates and often benefits from black bondage?

The first step is education: More fact-packed articles detailing the destructive impacts of racism can be found at www.quoflections.org\race.

Second, share these injustices with friends and family.

Third, let’s seek legislation ending the War on Drugs (really, the War on Black Men). Let’s eradicate laws discriminating against ex-felons. Let’s legalize a living wage. Also, our nation has the wealthiest white community in history, primarily due to centuries of labor stolen or cheated from African Americans. In the name of justice, we who are white can advocate for long-overdue reparations to be invested in neglected black communities.

Oh, and our pop quiz answer: Even in 2016, slavery continues on a massive scale.