Deprecated: Function get_magic_quotes_gpc() is deprecated in /hermes/bosnacweb08/bosnacweb08bf/b1577/ipg.rifuturecom/RIFutureNew/wp-includes/load.php on line 651
Notice: Trying to access array offset on value of type bool in /hermes/bosnacweb08/bosnacweb08bf/b1577/ipg.rifuturecom/RIFutureNew/wp-includes/theme.php on line 2241
Deprecated: Function get_magic_quotes_gpc() is deprecated in /hermes/bosnacweb08/bosnacweb08bf/b1577/ipg.rifuturecom/RIFutureNew/wp-includes/formatting.php on line 4387 RI Democratic Party – RI Future Deprecated: Function get_magic_quotes_gpc() is deprecated in /hermes/bosnacweb08/bosnacweb08bf/b1577/ipg.rifuturecom/RIFutureNew/wp-includes/formatting.php on line 4387
Deprecated: Function get_magic_quotes_gpc() is deprecated in /hermes/bosnacweb08/bosnacweb08bf/b1577/ipg.rifuturecom/RIFutureNew/wp-includes/formatting.php on line 4387
Deprecated: Function get_magic_quotes_gpc() is deprecated in /hermes/bosnacweb08/bosnacweb08bf/b1577/ipg.rifuturecom/RIFutureNew/wp-includes/formatting.php on line 4387
Deprecated: Function get_magic_quotes_gpc() is deprecated in /hermes/bosnacweb08/bosnacweb08bf/b1577/ipg.rifuturecom/RIFutureNew/wp-includes/formatting.php on line 4387
Deprecated: Function get_magic_quotes_gpc() is deprecated in /hermes/bosnacweb08/bosnacweb08bf/b1577/ipg.rifuturecom/RIFutureNew/wp-includes/formatting.php on line 4387
Deprecated: Function get_magic_quotes_gpc() is deprecated in /hermes/bosnacweb08/bosnacweb08bf/b1577/ipg.rifuturecom/RIFutureNew/wp-includes/formatting.php on line 4387
Deprecated: Function get_magic_quotes_gpc() is deprecated in /hermes/bosnacweb08/bosnacweb08bf/b1577/ipg.rifuturecom/RIFutureNew/wp-includes/formatting.php on line 4387
Deprecated: Function get_magic_quotes_gpc() is deprecated in /hermes/bosnacweb08/bosnacweb08bf/b1577/ipg.rifuturecom/RIFutureNew/wp-includes/formatting.php on line 4387
Deprecated: Function get_magic_quotes_gpc() is deprecated in /hermes/bosnacweb08/bosnacweb08bf/b1577/ipg.rifuturecom/RIFutureNew/wp-includes/formatting.php on line 4387
Deprecated: Function get_magic_quotes_gpc() is deprecated in /hermes/bosnacweb08/bosnacweb08bf/b1577/ipg.rifuturecom/RIFutureNew/wp-includes/formatting.php on line 4387
Rhode Island is one of the most progressive states in the country, at least when it comes to the views of its citizens. Its residents vote Democrat by large margins and generally hold views that are in agreement with—or to the left of—the national Democratic Party. So why is our government so conservative? In my opinion, a big part of the problem is the structure of the state Democratic Party and its cynical endorsement process.
Many RI voters seem not to be aware of this, but the state Democratic Party’s formal endorsement process provides substantial resources to the officially endorsed candidates at all levels of the election. Unendorsed candidates are frozen out of a wide variety of party resources and can only obtain them at significant extra expense, if they can get them at all. In addition, “endorsed” candidates automatically get top billing on the ballot, and a star appears next to their name, as if to suggest that they are the clearly superior choice (even though, as a rule, the opposite is far more likely).
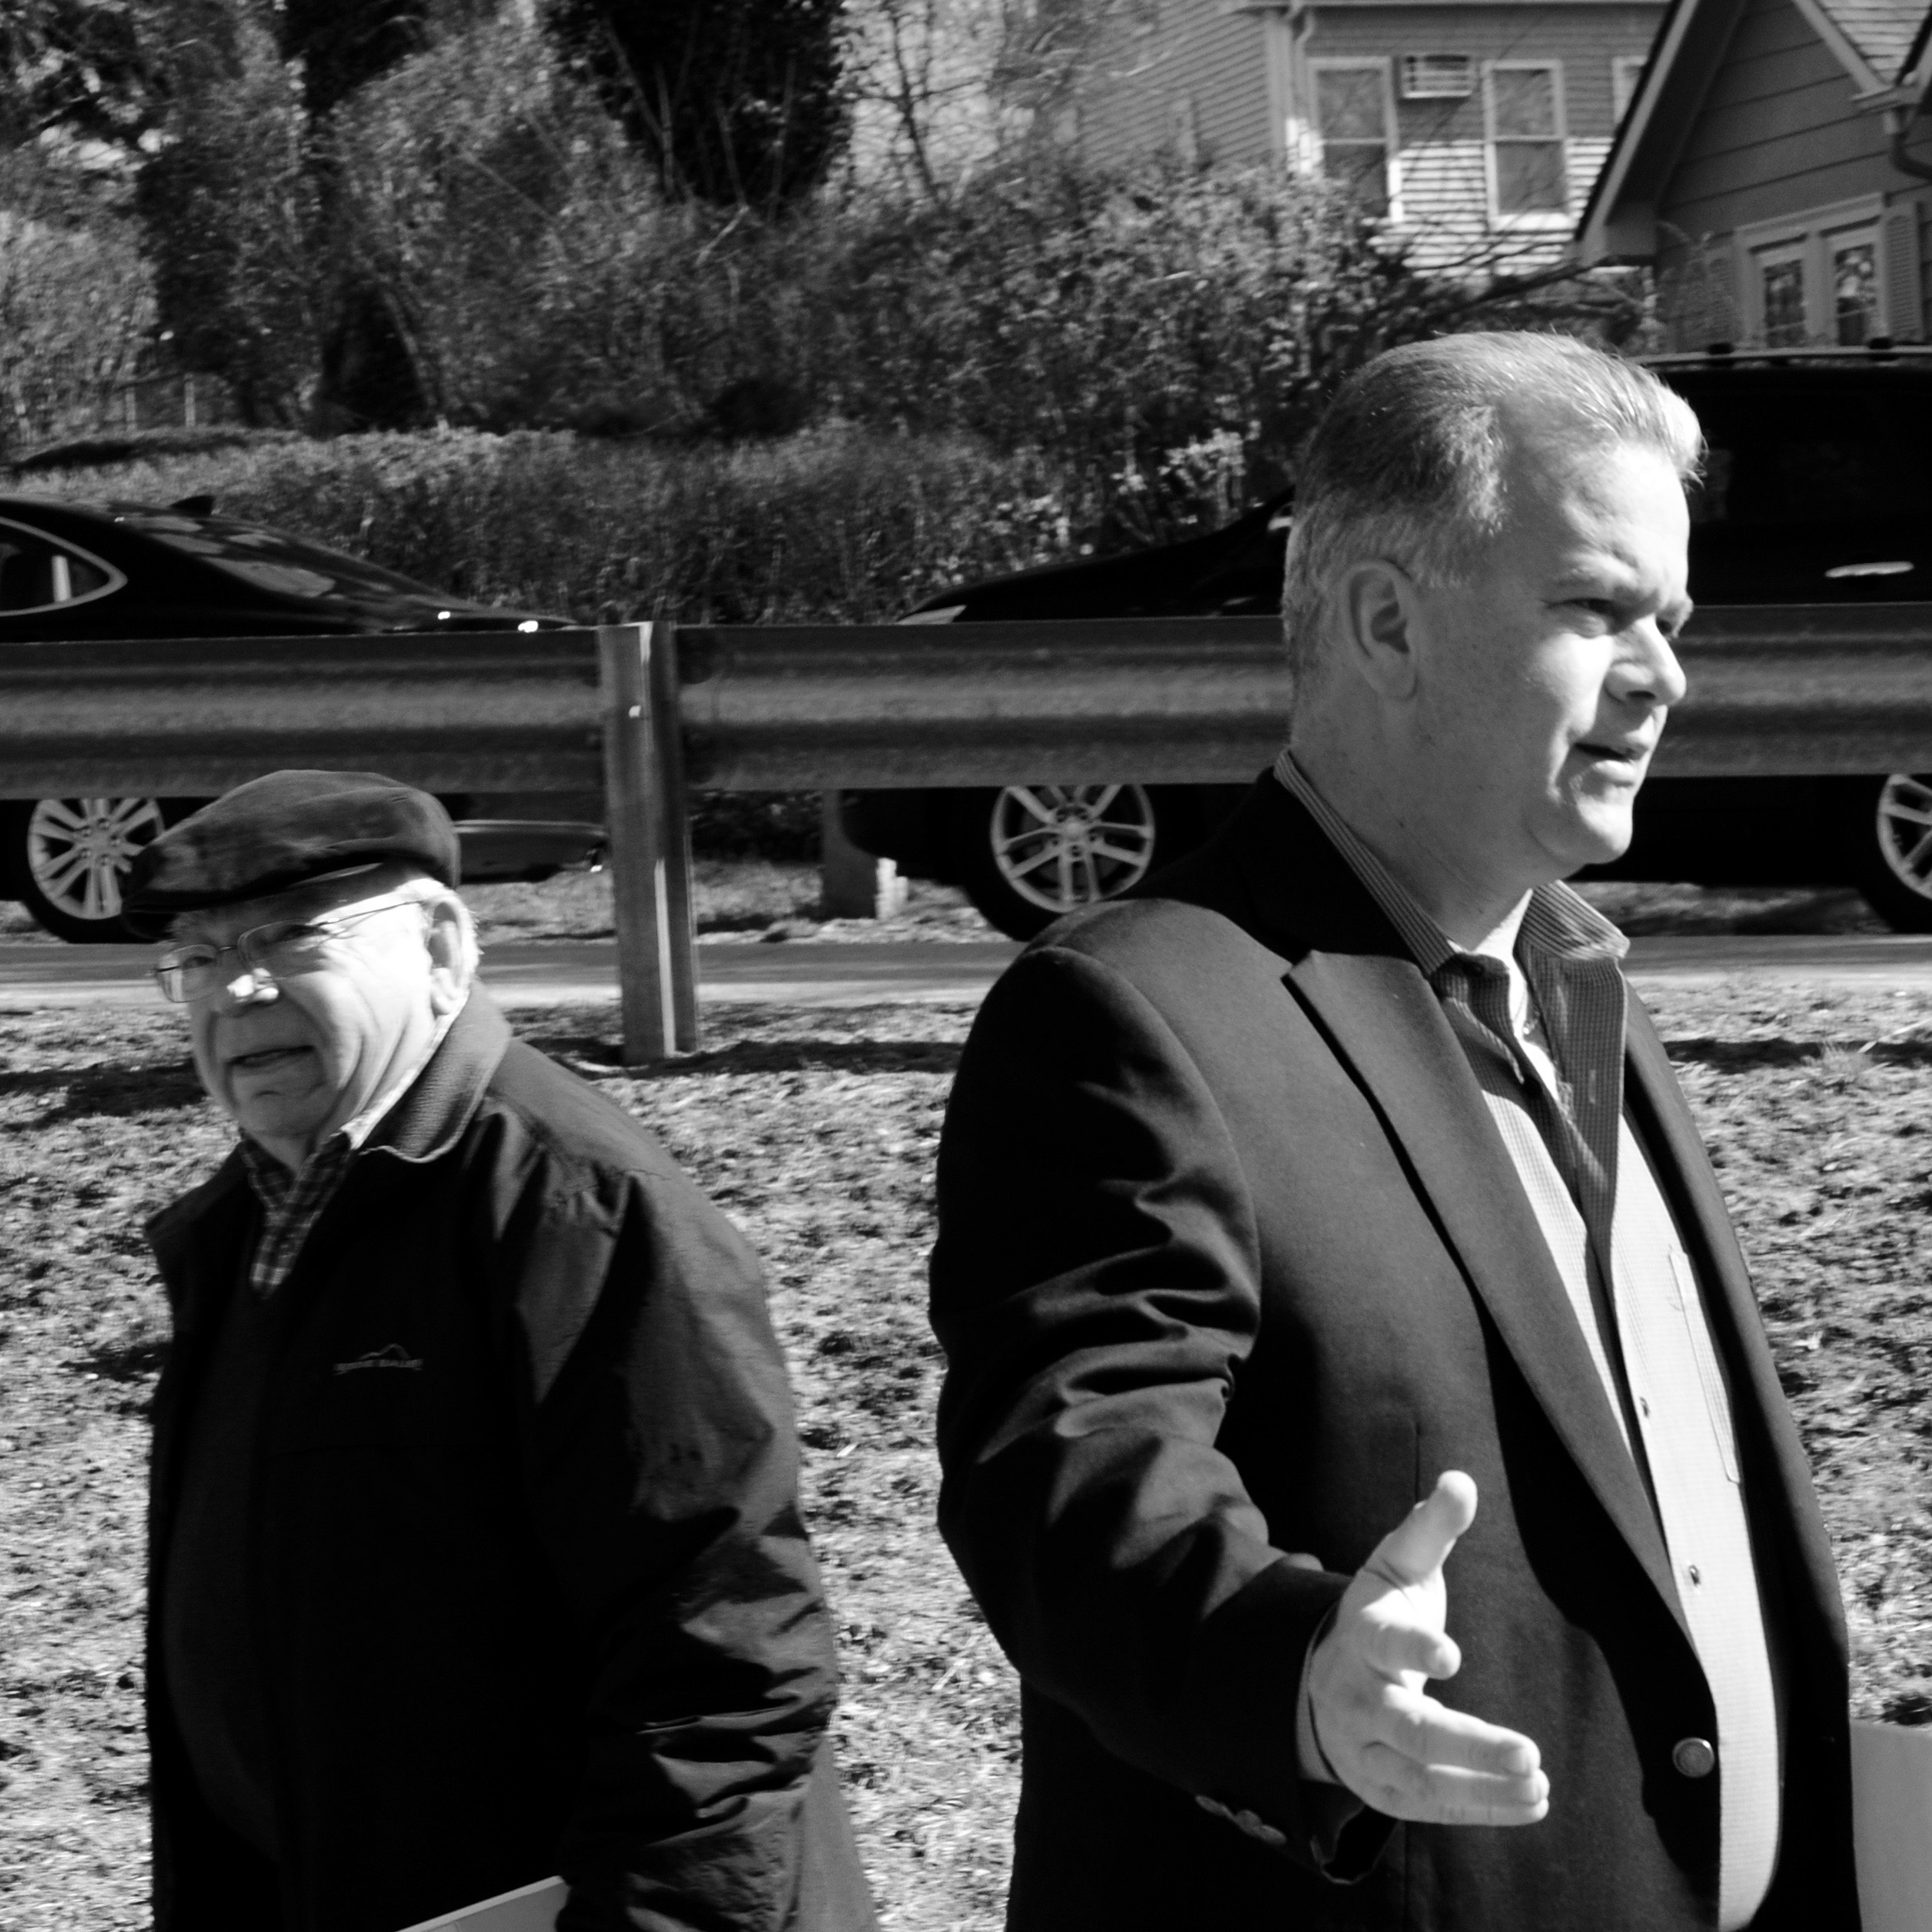
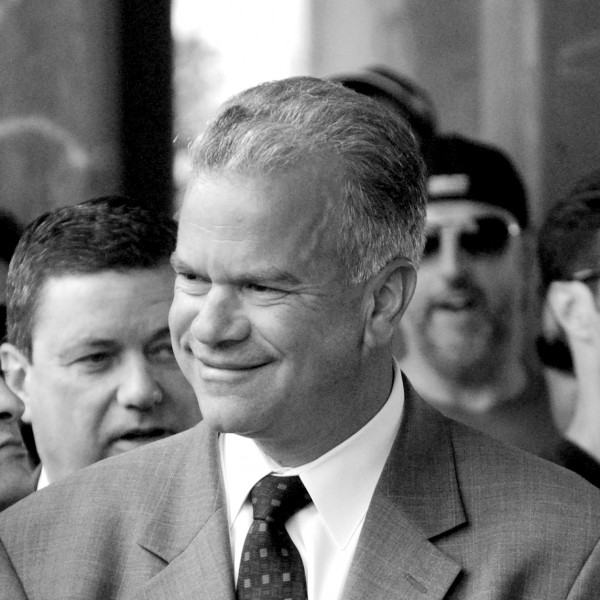
Nicholas Mattiello
So how does one become an endorsed candidate, you may ask? Well, there are a vast number of local, district, and ward committees who typically award these endorsements (but not always—see below!). In theory, these various ward, town, and district committees serve as a way of ensuring that people who live in an area have the opportunity to endorse the candidate who is most in touch with the needs of their neighborhoods. In practice, however, these ward and district committees are invariably stuffed with the friends, relatives, and even employees of the incumbents. As a result, they serve as little more than a rubber stamp that inevitably endorses the incumbent or their hand-picked successor—even when evidence of their corruption is overwhelming. And if by some chance a new voice manages to impress their local committees and gain their support, the RI Democratic Party chair—a person who is not elected to fill this role, but is merely appointed by prominent insiders such as Speaker Mattiello—can simply overrule the local committees and impose his will on them by fiat, as he recently did to Linda Finn, who earned the endorsements of her local town committees but whose opponent has secured the official party endorsement as well as all the corrupt resources that come with it.
When my fellow Democratic primary voters show up at the ballot box in September, I hope they will remember that a vote for the star is a vote to maintain the status quo. It’s a vote for Speaker Mattiello, and for the anti-democratic, cynical, corrupt, and above all elitist political machine from which he and his ilk draw their power. If you want change from your state and local elected officials next year, the choice is clear: Vote for anyone who doesn’t have Mattiello’s star of approval.
Deprecated: Function get_magic_quotes_gpc() is deprecated in /hermes/bosnacweb08/bosnacweb08bf/b1577/ipg.rifuturecom/RIFutureNew/wp-includes/formatting.php on line 4387
Despite the NRA paying a record fine for making illegal campaign donations to Rhode Island politicians, to date, not one current office holder in the state has seen fit to return the money.
The National Rifle Association (NRA) was fined by the RI Board of Elections for funneling illegal donations to RI politicians, including House Speaker Nicholas Mattiello and Senate President M Teresa Paiva-Weed. One estimate puts the total amount of contributions at over $160,000, over a 10 year period from 2004 to 2014. Due to the detective work of Sam Bell, executive director of the Rhode Island Progressive Democrats of America, the NRA was fined $63,000 and the NRA’s Rhode Island PAC was formally dissolved.
Technically, any money received by any candidate in Rhode Island that comes from the NRA Political Victory Fund PAC before January 2014 was illegal. That doesn’t mean that it’s a crime to keep the money after the fact, and it’s likely that the politicians did not know that the campaign donations were illegal before Bell made his case.
That said, the bottom line is that the money these politicians accepted from the NRA is tainted, and the influence this money has on our General Assembly can be felt acutely when observing the legislature in action.
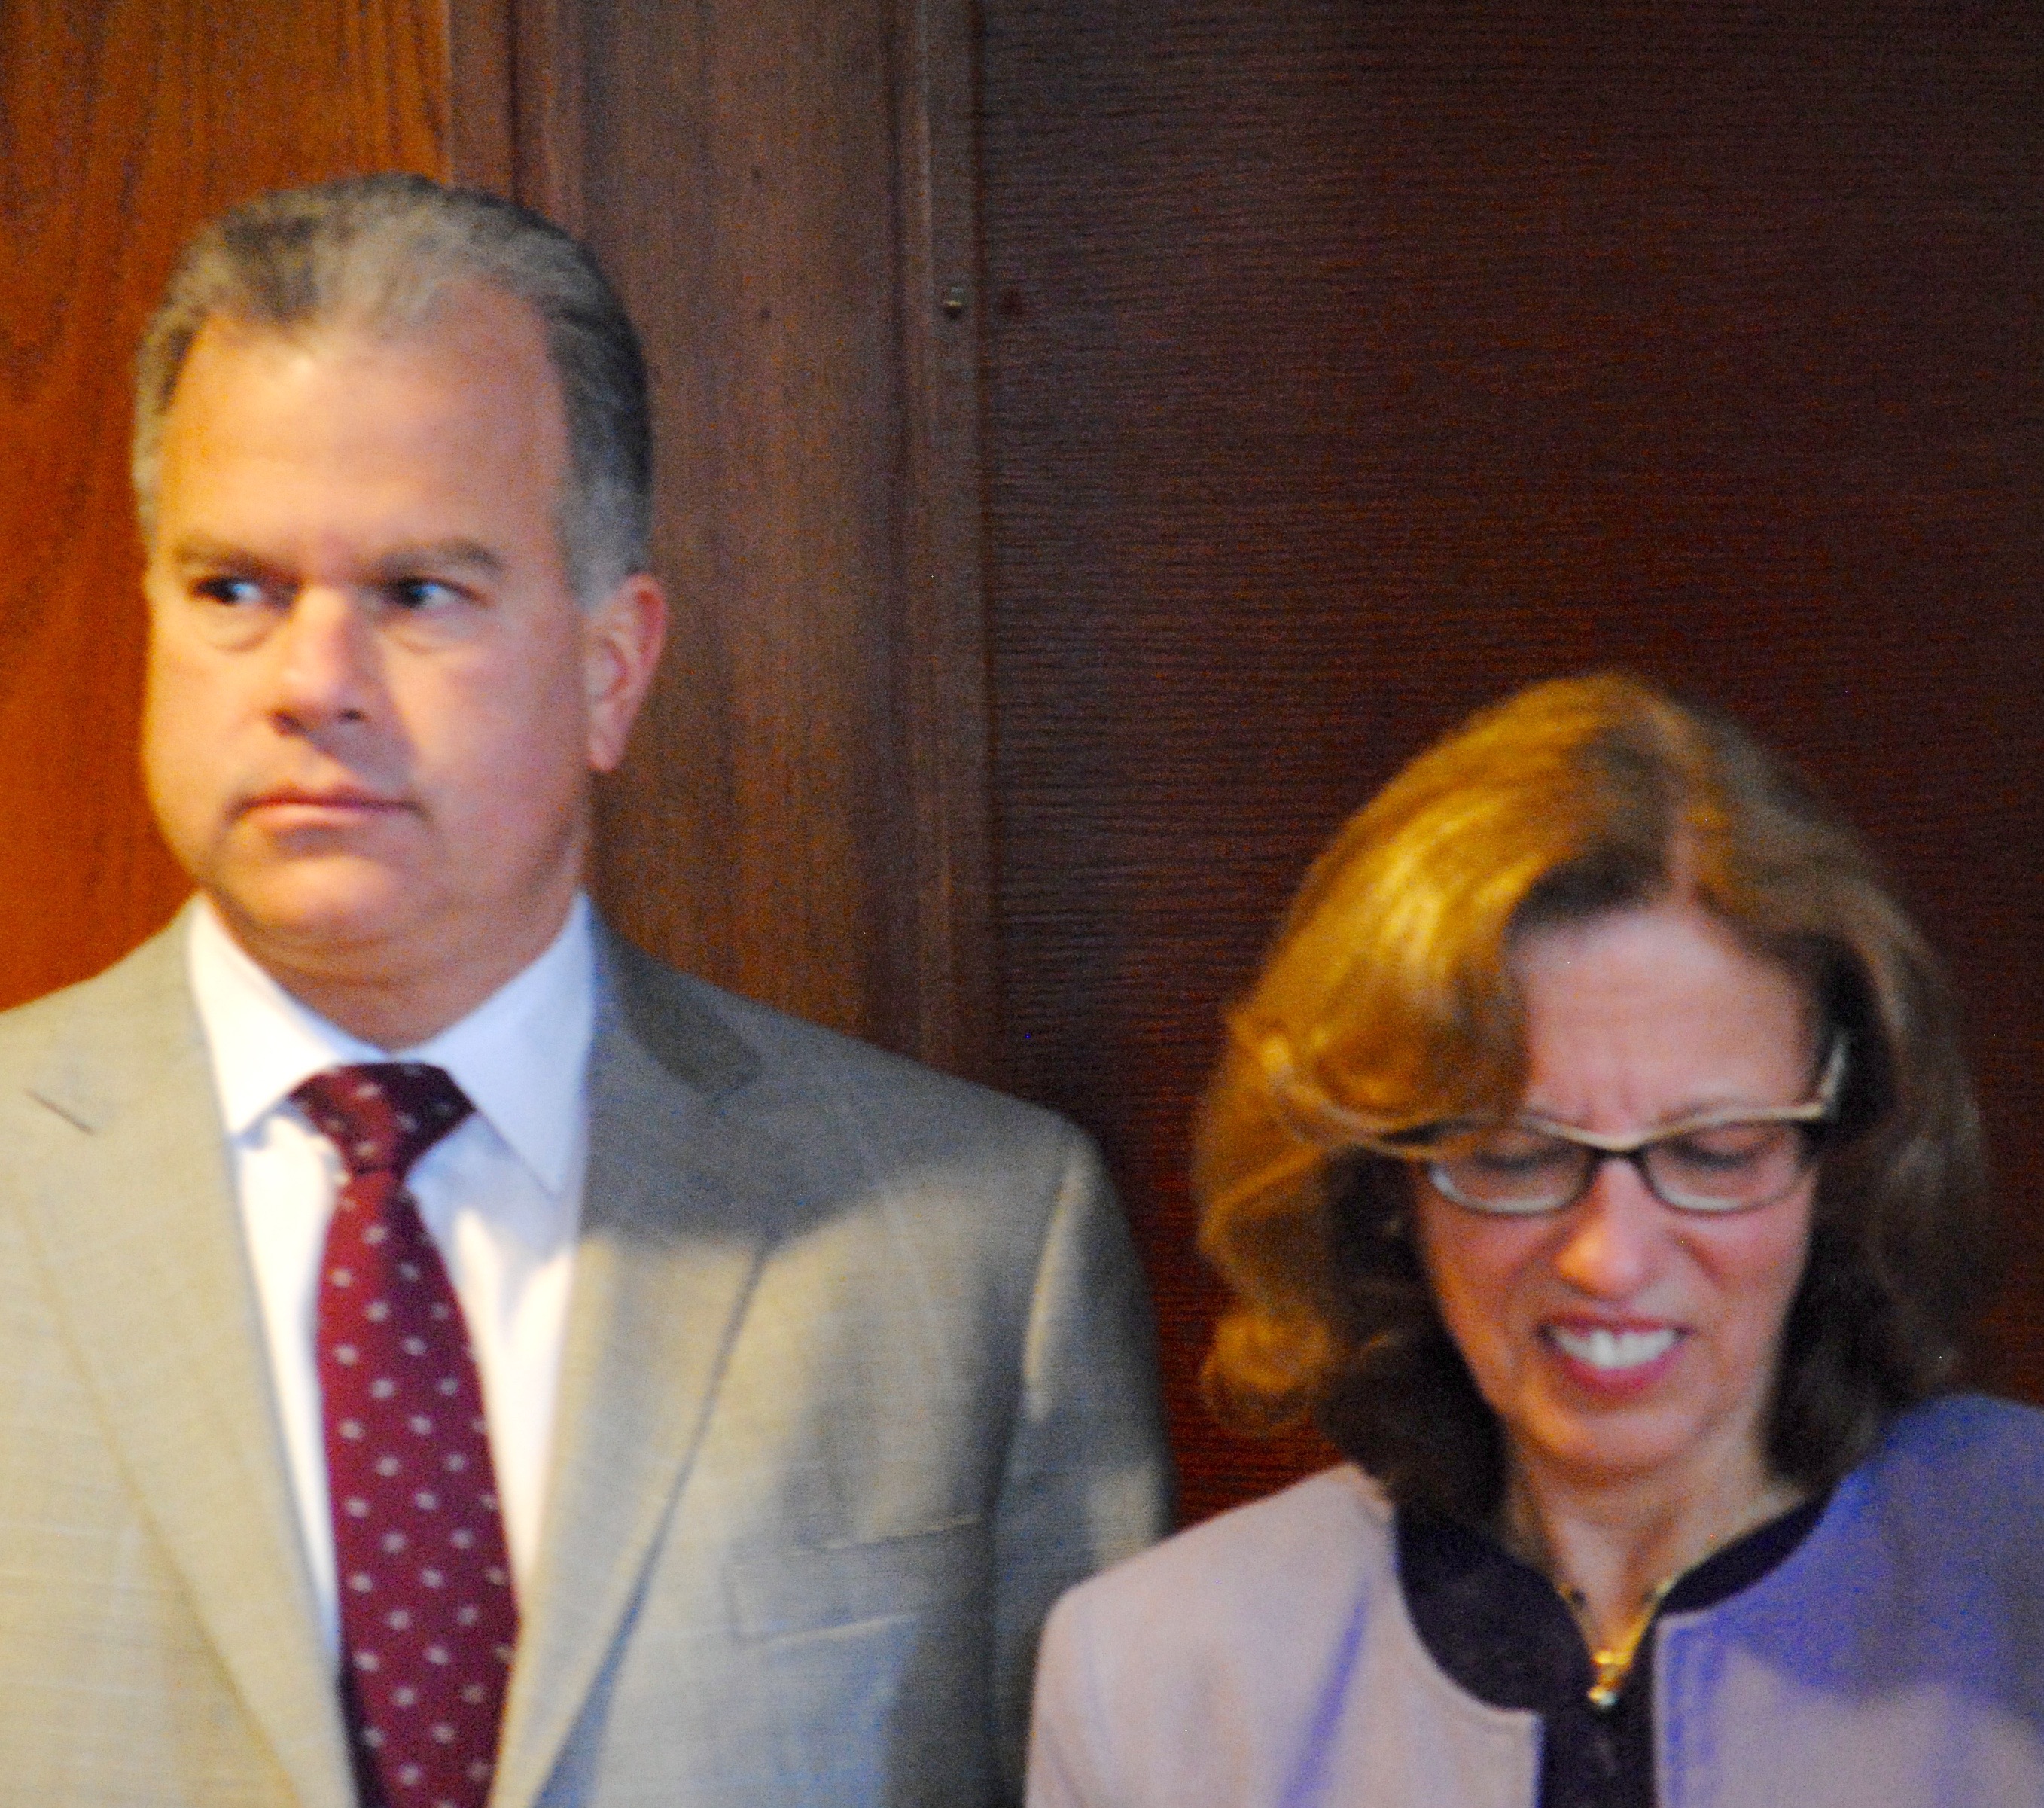
M Teresa Paiva Weed
Are you still wondering why our General Assembly can’t seem to pass common sense gun control legislation?
Between 2004 and 2014, House Speaker Nick Mattiello received $2,975 from the NRA. All these donations appear to be illegal, tainted contributions. The Speaker has kept every penny. Seventeen other representatives have also taken thousands of dollars.
Joseph McNamara is the head of the RI Democratic Party, the same party whose national platform calls for banning assault weapons and strengthening gun laws to prevent violence. McNamara accepted $700 in illegal NRA contributions over the years.
During the same 10 year period, Senate President M Teresa Paiva-Weed has accepted, and kept, what appears to be $6,075 in illegal contributions from the NRA. Seventeen other senators took illegal NRA cash, including Senate Majority Leader Domenic Ruggerio, who raked in $3350 and Senate Judiciary Chair Michael McCaffrey, whose committee handles every bill about guns that comes to the Senate, to the tune of$3500.
Rep Jan Malik, who was recently challenged by his primary opponent Jason Knight to return his illegal donations, took $1075. On the last day of the most recent legislative session, Rep Malik voted for a House bill that would have made it easier to get concealed carry permits in RI before changing his vote after the fact.
I went through the campaign finance reports available here, and carefully made a list of all incumbents who have accepted NRA money between 2004 and 2014.
Here’s the list:
In addition to Representatives and Senators, Attorney General Peter Kilmartin has accepted $1150 in illegal donations.
Attorney General KILMARTIN, PETER F 03/30/2004 $200.00
Attorney General KILMARTIN, PETER F 03/07/2006 $250.00
Attorney General KILMARTIN, PETER F 04/27/2007 $200.00
Attorney General KILMARTIN, PETER F 12/31/2009 $200.00
Attorney General KILMARTIN, PETER F 03/04/2009 $300.00
Former Speaker of the House, William Murphy, now a lobbyist, raked in a series of illegal NRA contributions. He now rakes in even more as a lobbyist for gun interests.
Lobbyist MURPHY, WILLIAM J 02/05/2004 $500.00
Lobbyist MURPHY, WILLIAM J 02/05/2004 $500.00
Lobbyist MURPHY, WILLIAM J 04/14/2006 $350.00
Lobbyist MURPHY, WILLIAM J 04/27/2007 $1,000.00
Lobbyist MURPHY, WILLIAM J 03/31/2005 $875.00
Lobbyist MURPHY, WILLIAM J 02/22/2009 $1,000.00
Lobbyist MURPHY, WILLIAM J 01/31/2008 $1,000.00
Representative MATTIELLO, NICHOLAS 11/05/2006 $250.00
Representative MATTIELLO, NICHOLAS 04/27/2007 $150.00
Representative MATTIELLO, NICHOLAS 04/01/2008 $150.00
Representative MATTIELLO, NICHOLAS 07/06/2010 $450.00
Representative MATTIELLO, NICHOLAS 04/04/2011 $450.00
Representative MATTIELLO, NICHOLAS 06/06/2012 $450.00
Representative MATTIELLO, NICHOLAS 02/13/2013 $800.00
Representative MATTIELLO, NICHOLAS 05/28/2009 $225.00
Representative CARNEVALE, JOHN M 06/05/2010 $200.00
Representative CARNEVALE, JOHN M 04/12/2011 $200.00
Representative CHIPPENDALE, MICHAEL W 10/15/2012 $500.00
Representative CORVESE, ARTHUR J 05/08/2004 $300.00
Representative CORVESE, ARTHUR J 05/16/2005 $300.00
Representative CORVESE, ARTHUR J 07/11/2006 $300.00
Representative COSTA, DOREEN MARIE 10/15/2012 $500.00
Representative DESIMONE, JOHN J 07/08/2004 $150.00
Representative FELLELA, DEBORAH A 08/20/2006 $250.00
Representative FELLELA, DEBORAH A 04/27/2007 $100.00
Representative FELLELA, DEBORAH A 01/12/2010 $150.00
Representative FELLELA, DEBORAH A 04/12/2011 $200.00
Representative JACQUARD, ROBERT B 07/19/2004 $300.00
Representative JACQUARD, ROBERT B 10/20/2004 $500.00
Representative JACQUARD, ROBERT B 10/12/2006 $350.00
Representative JACQUARD, ROBERT B 04/12/2011 $200.00
Representative KENNEDY, BRIAN PATRICK 07/19/2004 $400.00
Representative KENNEDY, BRIAN PATRICK 08/02/2006 $400.00
Representative KENNEDY, BRIAN PATRICK 06/11/2009 $400.00
Representative KENNEDY, BRIAN PATRICK 06/05/2010 $375.00
Representative KENNEDY, BRIAN PATRICK 04/12/2011 $375.00
Representative LIMA, CHARLENE 04/06/2004 $300.00
Representative MACBETH, KAREN 11/01/2009 $100.00
Representative MACBETH, KAREN 05/27/2010 $200.00
Representative MACBETH, KAREN 12/08/2011 $200.00
Representative MALIK, JAN 08/18/2004 $200.00
Representative MALIK, JAN 11/19/2004 $250.00
Representative MALIK, JAN 06/29/2005 $225.00
Representative MALIK, JAN 09/06/2006 $300.00
Representative MALIK, JAN 06/05/2010 $300.00
Representative MCNAMARA, JOSEPH 05/26/2004 $200.00
Representative MCNAMARA, JOSEPH 05/25/2005 $300.00
Representative MCNAMARA, JOSEPH 06/16/2011 $200.00
Representative MELO, HELIO 03/10/2010 $225.00
Representative MELO, HELIO 04/12/2011 $200.00
Representative NEWBERRY, BRIAN C 11/03/2006 $300.00
Representative NEWBERRY, BRIAN C 05/29/2009 $150.00
Representative NEWBERRY, BRIAN C 02/24/2010 $150.00
Representative NEWBERRY, BRIAN C 06/29/2011 $200.00
Representative NEWBERRY, BRIAN C 04/15/2013 $250.00
Representative TRILLO, JOSEPH A 04/02/2004 $100.00
Representative TRILLO, JOSEPH A 04/05/2004 $500.00
Representative TRILLO, JOSEPH A 04/06/2004 $200.00
Representative TRILLO, JOSEPH A 04/07/2004 $100.00
Representative TRILLO, JOSEPH A 04/22/2004 $150.00
Representative TRILLO, JOSEPH A 06/29/2005 $200.00
Representative TRILLO, JOSEPH A 06/15/2006 $300.00
Representative TRILLO, JOSEPH A 07/24/2007 $300.00
Representative TRILLO, JOSEPH A 05/17/2008 $300.00
Representative TRILLO, JOSEPH A 05/29/2009 $300.00
Representative TRILLO, JOSEPH A 06/05/2010 $300.00
Representative TRILLO, JOSEPH A 04/12/2011 $200.00
Representative UCCI, STEPHEN R 11/19/2004 $500.00
Representative UCCI, STEPHEN R 08/21/2006 $250.00
Representative UCCI, STEPHEN R 11/02/2006 $200.00
Representative UCCI, STEPHEN R 07/27/2007 $300.00
Representative UCCI, STEPHEN R 06/29/2009 $200.00
Representative UCCI, STEPHEN R 06/29/2009 $200.00
Representative UCCI, STEPHEN R 06/25/2011 $200.00
Representative UCCI, STEPHEN R 06/15/2010 $200.00
Representative WINFIELD, THOMAS J 08/22/2004 $200.00
Representative WINFIELD, THOMAS J 06/15/2006 $200.00
Representative WINFIELD, THOMAS J 11/06/2006 $90.00
Representative WINFIELD, THOMAS J 08/10/2007 $225.00
Senator PAIVA WEED, M TERESA 02/24/2011 $1,000.00
Senator PAIVA WEED, M TERESA 02/02/2012 $1,000.00
Senator PAIVA WEED, M TERESA 08/12/2013 $800.00
Senator PAIVA WEED, M TERESA 04/22/2004 $375.00
Senator PAIVA WEED, M TERESA 05/14/2007 $500.00
Senator PAIVA WEED, M TERESA 05/17/2008 $400.00
Senator PAIVA WEED, M TERESA 02/11/2009 $1,000.00
Senator PAIVA WEED, M TERESA 02/24/2010 $1,000.00
Senator CICCONE III, FRANK A 07/10/2004 $150.00
Senator CICCONE III, FRANK A 05/25/2005 $225.00
Senator CICCONE III, FRANK A 06/21/2006 $300.00
Senator CICCONE III, FRANK A 11/03/2006 $300.00
Senator CICCONE III, FRANK A 05/07/2007 $300.00
Senator CICCONE III, FRANK A 04/15/2008 $300.00
Senator CICCONE III, FRANK A 06/03/2009 $300.00
Senator CICCONE III, FRANK A 06/12/2010 $300.00
Senator CICCONE III, FRANK A 06/21/2013 $400.00
Senator COTE, MARC A 03/23/2004 $200.00
Senator COTE, MARC A 05/16/2005 $200.00
Senator COTE, MARC A 06/15/2006 $200.00
Senator COTE, MARC A 04/16/2008 $200.00
Senator COTE, MARC A 04/06/2010 $200.00
Senator DAPONTE, DANIEL 02/24/2010 $200.00
Senator DAPONTE, DANIEL 04/12/2011 $200.00
Senator DOYLE II, JAMES E 06/17/2006 $150.00
Senator DOYLE II, JAMES E 03/31/2008 $300.00
Senator FELAG JR, WALTER S 07/04/2004 $200.00
Senator FELAG JR, WALTER S 09/01/2006 $300.00
Senator FELAG JR, WALTER S 06/15/2008 $300.00
Senator FELAG JR, WALTER S 03/03/2010 $300.00
Senator FELAG JR, WALTER S 04/12/2011 $300.00
Senator FOGARTY, PAUL W 05/13/2004 $100.00
Senator FOGARTY, PAUL W 07/01/2005 $150.00
Senator FOGARTY, PAUL W 09/21/2007 $150.00
Senator FOGARTY, PAUL W 01/10/2008 $150.00
Senator FOGARTY, PAUL W 06/11/2009 $200.00
Senator GALLO, HANNA M 06/01/2004 $150.00
Senator GALLO, HANNA M 05/24/2005 $150.00
Senator GALLO, HANNA M 05/17/2008 $150.00
Senator GALLO, HANNA M 08/05/2009 $200.00
Senator GALLO, HANNA M 04/28/2011 $200.00
Senator GALLO, HANNA M 04/12/2011 $200.00
Senator GOODWIN, MARYELLEN 08/16/2004 $150.00
Senator GOODWIN, MARYELLEN 07/09/2010 $200.00
Senator GOODWIN, MARYELLEN 05/13/2011 $200.00
Senator LYNCH PRATA, ERIN P 06/08/2009 $200.00
Senator LYNCH PRATA, ERIN P 06/10/2010 $200.00
Senator LYNCH PRATA, ERIN P 04/12/2011 $200.00
Senator MCCAFFREY, MICHAEL J 07/21/2004 $500.00
Senator MCCAFFREY, MICHAEL J 07/21/2005 $750.00
Senator MCCAFFREY, MICHAEL J 08/06/2006 $750.00
Senator MCCAFFREY, MICHAEL J 08/07/2007 $750.00
Senator MCCAFFREY, MICHAEL J 06/24/2008 $750.00
Senator MCCAFFREY, MICHAEL J 06/05/2009 $750.00
Senator MCCAFFREY, MICHAEL J 06/15/2010 $750.00
Senator MCCAFFREY, MICHAEL J 05/20/2011 $750.00
Senator MCCAFFREY, MICHAEL J 06/28/2013 $400.00
Senator PICARD, ROGER A 07/19/2004 $200.00
Senator PICARD, ROGER A 08/03/2005 $200.00
Senator PICARD, ROGER A 05/15/2006 $250.00
Senator PICARD, ROGER A 06/20/2009 $300.00
Senator PICARD, ROGER A 06/12/2010 $150.00
Senator RAPTAKIS, LEONIDAS P 05/10/2006 $300.00
Senator RAPTAKIS, LEONIDAS P 07/24/2007 $300.00
Senator RAPTAKIS, LEONIDAS P 06/30/2008 $300.00
Senator RAPTAKIS, LEONIDAS P 02/26/2013 $250.00
Senator RAPTAKIS, LEONIDAS P 07/19/2004 $300.00
Senator RUGGERIO, DOMINICK J 05/19/2004 $300.00
Senator RUGGERIO, DOMINICK J 05/25/2005 $300.00
Senator RUGGERIO, DOMINICK J 05/10/2006 $300.00
Senator RUGGERIO, DOMINICK J 04/27/2007 $300.00
Senator RUGGERIO, DOMINICK J 05/17/2008 $300.00
Senator RUGGERIO, DOMINICK J 02/21/2013 $500.00
Senator RUGGERIO, DOMINICK J 05/29/2009 $300.00
Senator RUGGERIO, DOMINICK J 02/24/2011 $450.00
Senator RUGGERIO, DOMINICK J 02/08/2012 $500.00
Senator SERPA, PATRICIA A 07/01/2009 $150.00
Senator SERPA, PATRICIA A 06/05/2010 $150.00
Senator SERPA, PATRICIA A 07/18/2011 $200.00
Senator SERPA, PATRICIA A 03/30/2013 $250.00
Senator SHEEHAN, JAMES C 05/04/2004 $150.00
Senator SHEEHAN, JAMES C 07/08/2005 $150.00
Senator SHEEHAN, JAMES C 07/24/2007 $100.00
Senator SOSNOWSKI, V SUSAN 07/28/2004 $200.00
Senator SOSNOWSKI, V SUSAN 10/18/2004 $100.00
Senator SOSNOWSKI, V SUSAN 04/08/2008 $200.00
Senator SOSNOWSKI, V SUSAN 03/02/2010 $200.00
Senator SOSNOWSKI, V SUSAN 06/16/2011 $200.00
Senator WALASKA, WILLIAM A 04/26/2004 $300.00
Senator WALASKA, WILLIAM A 04/05/2005 $300.00
Senator WALASKA, WILLIAM A 09/01/2006 $300.00
Senator WALASKA, WILLIAM A 05/02/2007 $300.00
Senator WALASKA, WILLIAM A 05/17/2008 $300.00
Senator WALASKA, WILLIAM A 06/07/2009 $300.00
Senator WALASKA, WILLIAM A 06/05/2010 $300.00
Senator WALASKA, WILLIAM A 04/12/2011 $300.00
RI HOUSE DEMOCRATIC LEADERSHIP COMMITTEE 04/29/2004 $300.00
RI HOUSE DEMOCRATIC LEADERSHIP COMMITTEE 09/15/2005 $300.00
RI HOUSE DEMOCRATIC LEADERSHIP COMMITTEE 04/06/2006 $200.00
Deprecated: Function get_magic_quotes_gpc() is deprecated in /hermes/bosnacweb08/bosnacweb08bf/b1577/ipg.rifuturecom/RIFutureNew/wp-includes/formatting.php on line 4387
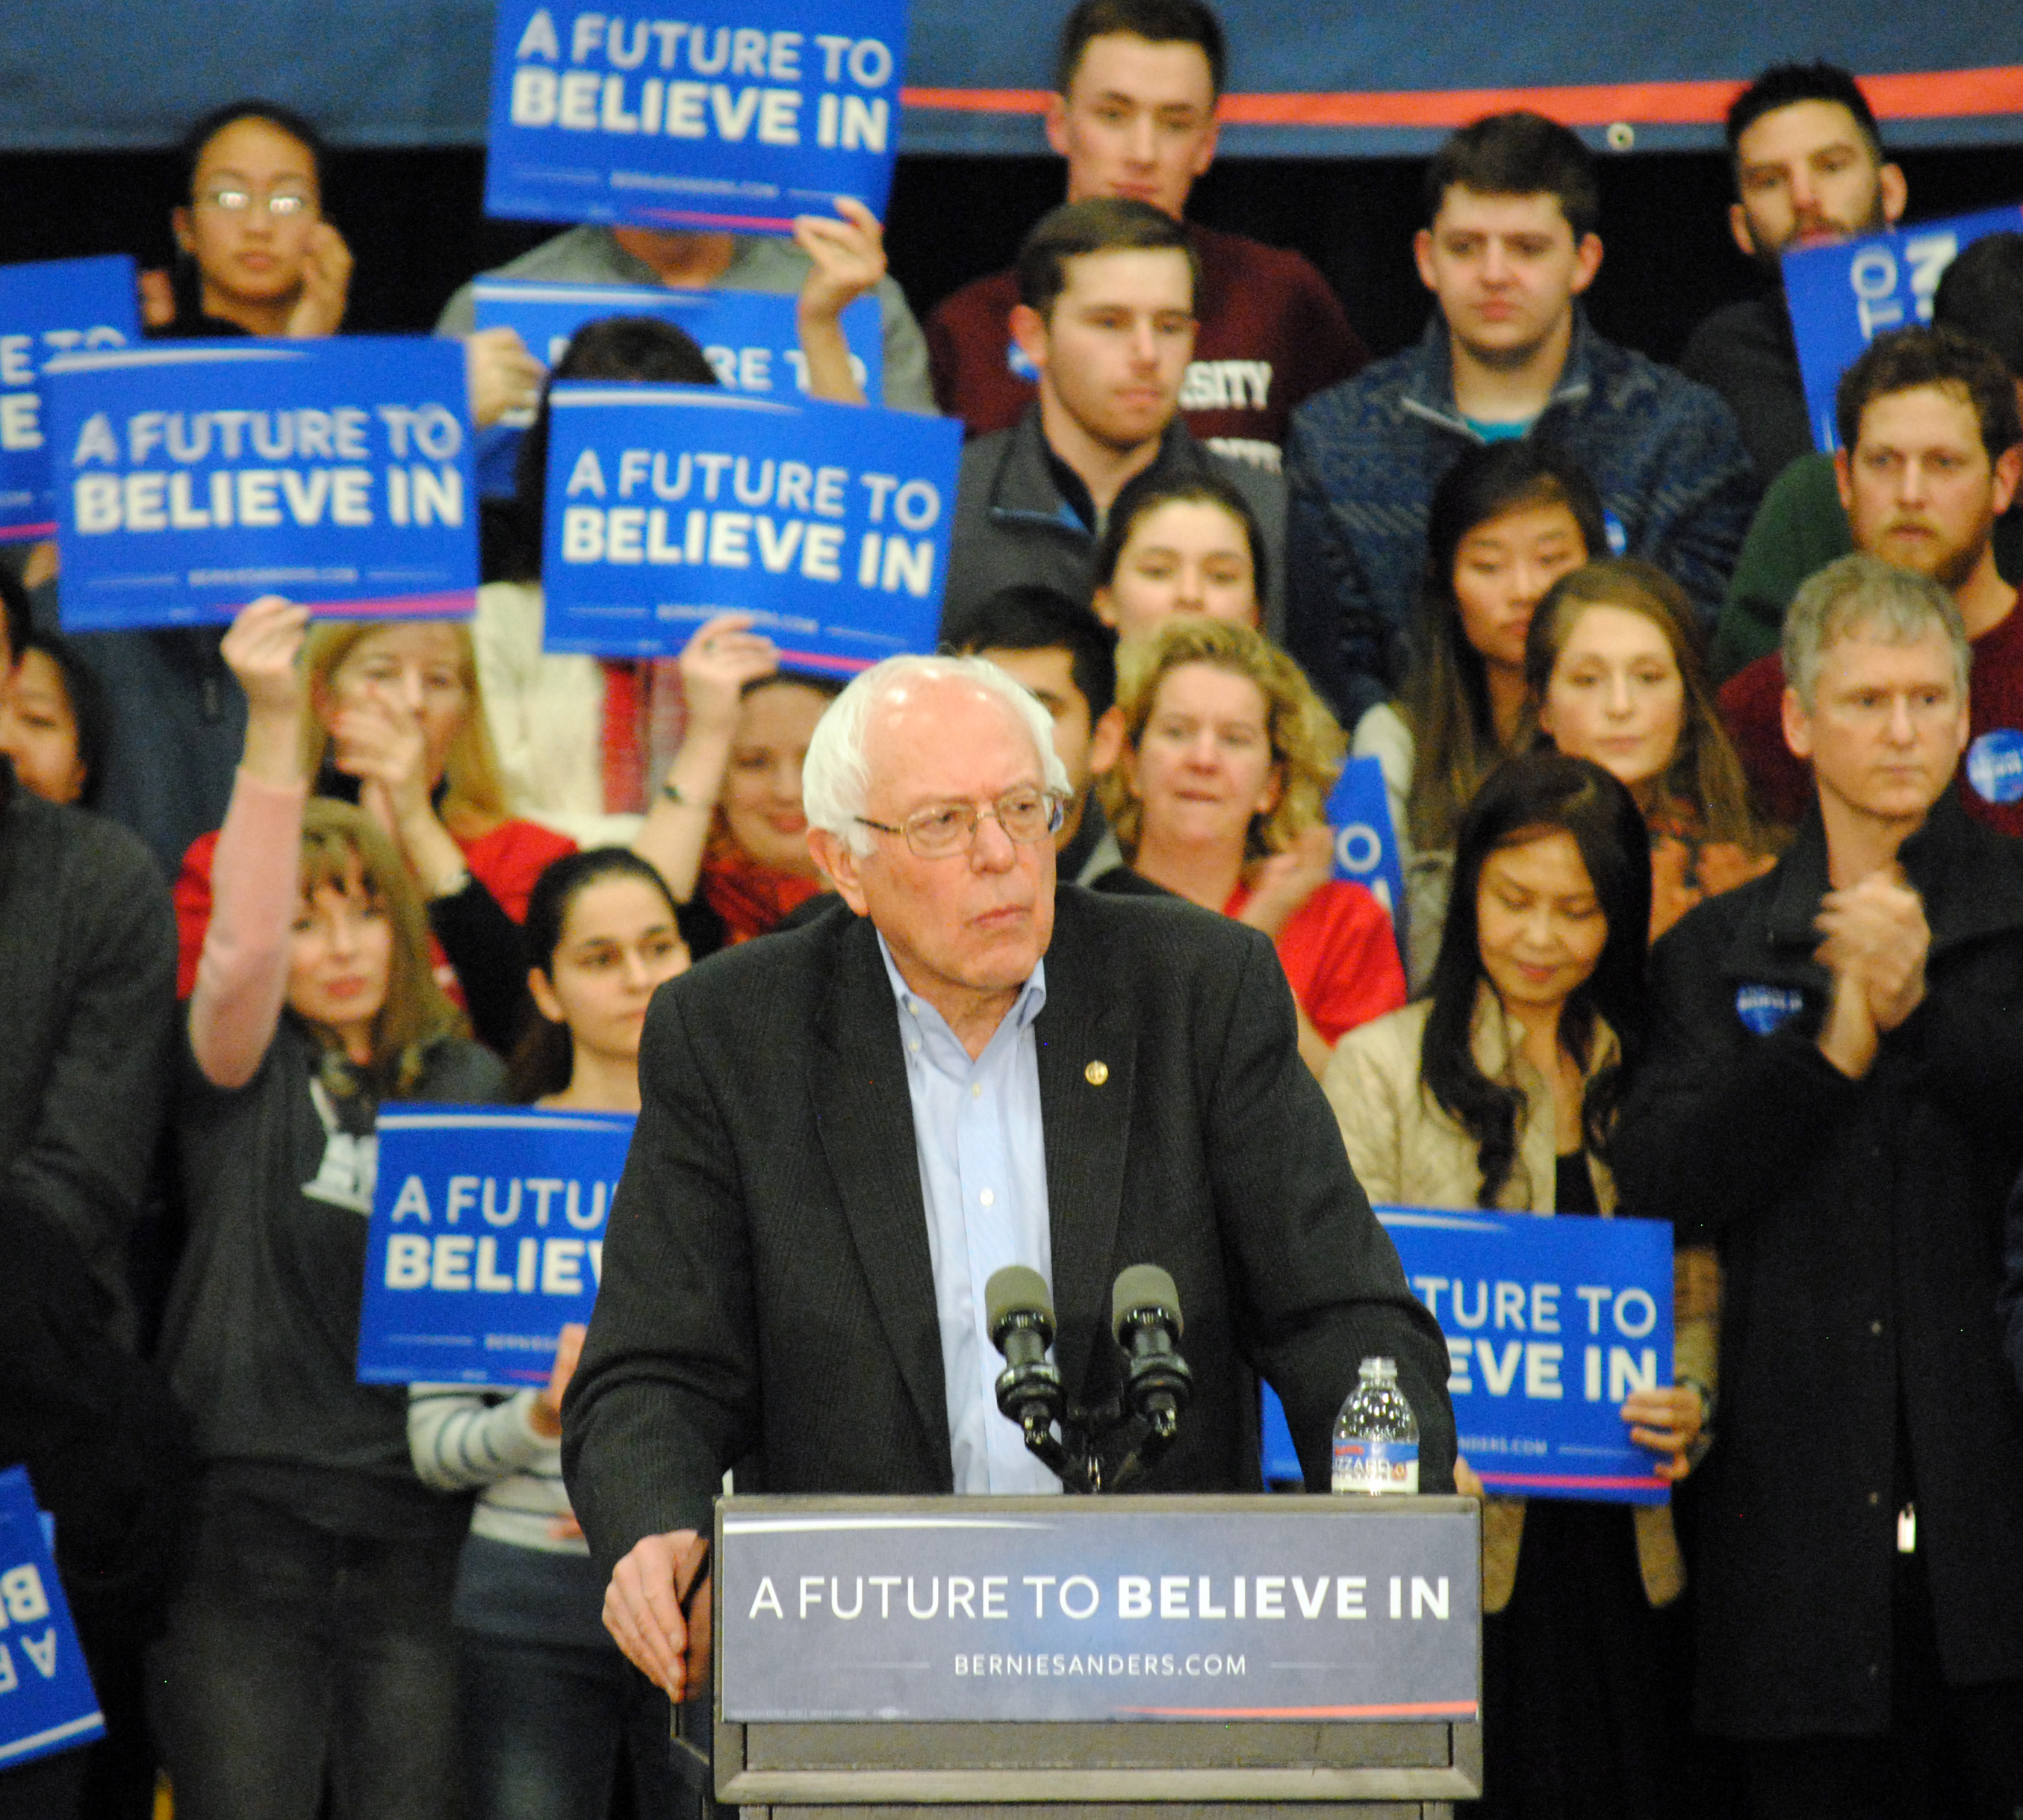
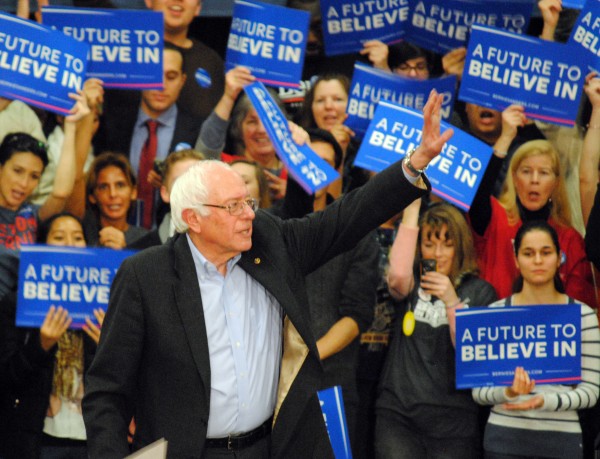
After successfully getting the most signatures of any presidential primary candidate, Bernie Sanders’ Rhode Island campaign will now focus on getting a slate of delegates on the ballot for Bernie.
Sanders supporters gathered 3451 official signatures, Hillary Clinton supporters, backed by the RI Democratic Party, gathered only 1802. On the Republican side Trump supporters gathered 3110 signatures, followed by 2902 for Jeb Bush, who has already dropped out of the race.
There will be events throughout the state where people can go to sign nomination papers for those seeking to be delegates. Our Kickoff event will be from 7:00pm-9:00pm on Thursday, February 25th at the Wild Colonial in Providence on South Water Street.
For a listing of all the signature signing events or to volunteer for Bernie 2016 campaign go to www.Berniesanders.com or to this Facebook page.
Or contact
Lauren Niedel
RI State Contact
401-710-7600
lniedel@gmail.com
Deprecated: Function get_magic_quotes_gpc() is deprecated in /hermes/bosnacweb08/bosnacweb08bf/b1577/ipg.rifuturecom/RIFutureNew/wp-includes/formatting.php on line 4387
Clay, Angel or Gina: who will be the best for the progressive movement in RI?
In the last few years the General Assembly has passed legislation that slashed pensions, cut taxes on the wealthiest Rhode Islanders, recklessly combined the State’s boards of education, and instituted a discriminatory and unnecessary Voter ID law. And, of course, all while under the auspices of the Democratic Party.
It’s no secret then, that progressives are dissatisfied with the status quo of Rhode Island. There have been victories; notably marriage equality. But marriage equality only arrived after a compromise of civil unions riled up enough people that there was a large-scale campaign to gain true equality before the law. Full progressive change in Rhode Island happens when there is a confluence of outrage and money.
What has tided progressives over is a series of compromise: the most progressive change possible, the most progressive candidate possible. U.S. Sen. Sheldon Whitehouse, U.S. Rep. David Cicilline, and Gov. Lincoln Chafee are all beneficiaries of this. While some of them have not been the most progressive candidate in their races, they have been the most progressive candidate possible.
But recent events in New York City and Boston have empowered progressives across the country, and Rhode Island progressives especially have taken note (sandwiched, as they are, between those two regional poles). Candidates with explicitly progressive campaigns have won mayoral races in those cities in off-election years. The New York City example of Bill de Blasio is especially hopeful. NYC has a population of somewhere around 7 times larger than the entirety of Rhode Island, which despite a Democratic majority has been ruled by non-Democrats since 1994, the last full year in which there was a Democratic governor in Rhode Island.
If it can happen in New York and Boston, then it can happen here, the reasoning goes. As Rhode Island progressives eye the governor’s race, they may start drawing parallels with New York City. This may explain the hoopla over Clay Pell, the untested scion of Rhode Island’s greatest political legacy.
There are a few factors to consider. First, progressives may believe they are the Democratic Party, but that’s ultimately false. Many of Rhode Island’s Democrats are more accurately described as “Christian democrats” generally socially conservative but supportive of social justice and welfare. These are the elder type of Democrats, part of the party before the progressives split from the Republicans. The reality is that Rhode Island’s Democratic Party incorporates three general sections; the progressives, the Christian democrats, and the neoliberals. There are also some genuine conservatives.
However, of these three wings, the progressives are by far the most politically dangerous and important. Time and time again they’ve proven they can break or make Democratic candidates. Therefore, it’s not surprising to see all Democratic candidates in the gubernatorial primary proclaim themselves progressives.
Progressives have a pastime of DINO-hunting, which generally means weeding out the Christian democrats or neoliberals. But as the gubernatorial race approaches, they may find themselves hunting progressives-in-name-only instead. I doubt I’m wrong in thinking that progressives believe that if the first elected Democratic governor is coming in 2014 they’ll allow that governor to be anything short of a true-blue progressive.
Providence Mayor Angel Taveras is especially vulnerable to the whims of progressive fervor. He’s managed to position himself somewhere between the neoliberal position and the progressive position. Meanwhile, General Treasurer Gina Raimondo has been firmly defined as part of the neoliberals; the “Wall St. Democrats.” But that line-walking is not playing as well as it should. On a recent appearance on WPRI’s Newsmakers, when pressed by Ted Nesi, Taveras was unable to draw a distinction between himself and Raimondo in terms of actual policy, suggesting that it’ll come out in the campaign.
On one hand, that’s correct; and politically it’s unnecessary to draw a distinction this early when Rhode Islanders won’t be paying attention for another year or so. But on the other, those contrasts should be clear already, especially as activists begin examining the candidates closely and building enthusiasm for campaign season.
Taveras’ vulnerability is clear in Clay Pell, as ill-defined a candidate as ever there was. We know virtually nothing about him beyond the name, a brief biographical sketch, and that his wife is Olympian Michelle Kwan. Yet Pell is bending progressives towards his center of gravity, and that should be worrying this early. His grandfather was also a relative unknown who defeated two former Governors for his U.S. Senate seat.
Despite their strengths, one shouldn’t think of the progressives as a wholly deciding factor though. For one thing, the movement is, like most things in Rhode Island, fractious and full of personalities. With the disbanding of Ocean State Action, the main meeting table and organizing presence for progressive groups has been removed. For another, what gets defined as truly “progressive” is open to debate. And finally, while the gubernatorial race will gain the most attention, the real power lies in the General Assembly, where progressives will have to focus on electing more friendly candidates as well as protecting those they already have.
2014 will be a serious test for progressives in Rhode Island. Can they elect a governor who represents their values? Can they take a controlling majority in the Assembly? And should they manage that, will they be able to produce results and right Rhode Island after years of neoliberal failure?
Deprecated: Function get_magic_quotes_gpc() is deprecated in /hermes/bosnacweb08/bosnacweb08bf/b1577/ipg.rifuturecom/RIFutureNew/wp-includes/formatting.php on line 4387
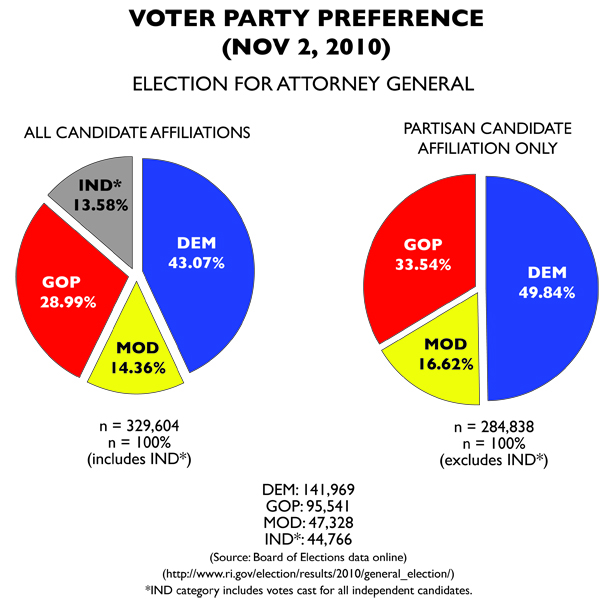
Voter percentages from 2010. DEM = Democratic Party, GOP = Republican Party, IND = Independent, MOD = Moderate Party. Due to rounding, not all percentages will add up to 100% (via Samuel G. Howard)
The problem with the gubernatorial results is the massive amount of independent votes that have to be thrown out. Luckily, the AG race offers a more typically Rhode Island affair, though a large amount of independent votes are tossed, but only about equal to what the Moderate Party candidate earned.
That Moderate candidate is the most interesting. The former chair of Common Cause RI and the former President of Save the Bay, lawyer Christopher Little best represented the “environment and ethics” part of the Moderate platform. And his vote performance was better than that of his gubernatorial counterpart Ken Block. Why Little has never been emphasized by the Moderates since is an oddity to me.
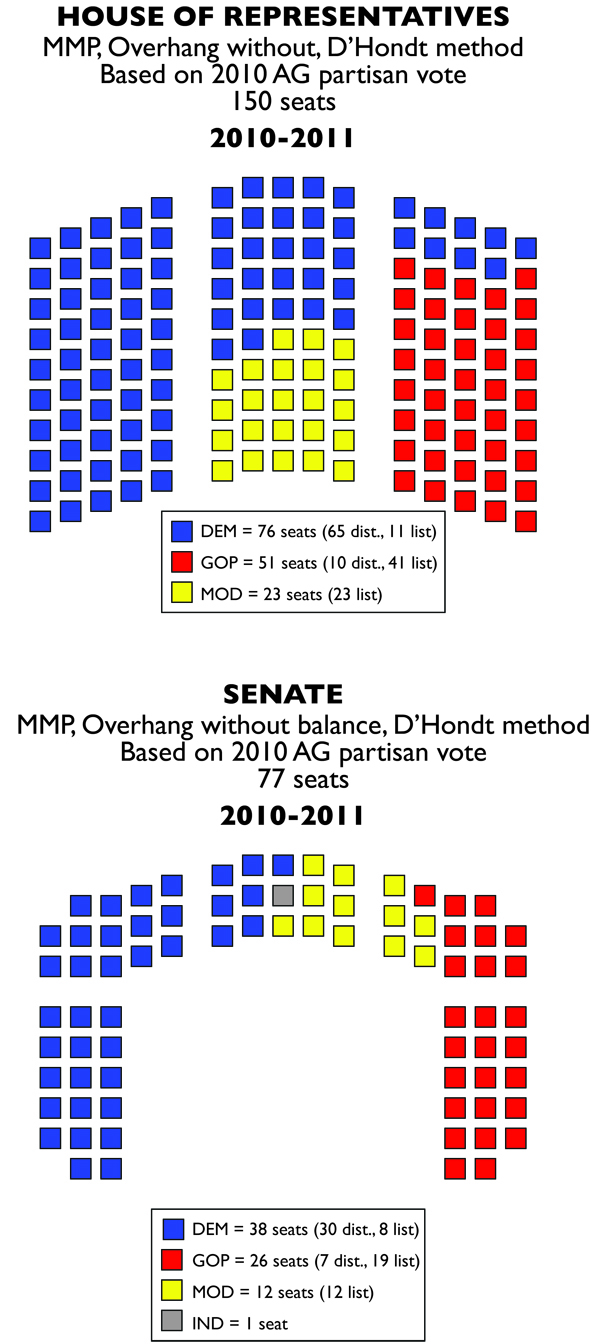
If the AG race is used as our party preference ballot, the result is the best case for the Moderates short of winning a majority (which would require a crisis of voter faith).
What happens is that the Democrats retain a majority in the House (by one seat only) and have a plurality in the Senate (short by one seat). In this case, the large number of Reps and Senators won by the Moderates can act a drivers of policy. In the Senate, Democrats either have to make a coalition agreement with one of the two parties, or they have to manage to get a leadership team put together with the approval of some members of the other parties or independent Edward O’Neill.
O’Neill’s vote actually becomes very important as well. As an independent, he can be the deciding vote in a showdown between a Moderate-Republican coalition and the Democratic caucus.
The House is a bit different. House Democrats have to be really cautious and not bring any legislation to vote that alienates their caucus and fails to win cross-party support. Otherwise, they could see their leadership team overthrown by a group of disaffected Democratic reps allied with the Moderates and Republicans. Alternatively, they could spurn the left-wing of their party and join with Moderate or Republican legislators to form a cross-party leadership. However, that could damage all parties together, making Republican legislators vulnerable to right wing dissatisfaction, Democratic legislators vulnerable to left wing dissatisfaction, and Moderates vulnerable to voter scorn. How it would shake out would be largely due to personalities.
RI GA apportioned according to the D’Hondt method using 2010 AG results. (via Samuel G. Howard)
This is Part 12 of the MMP RI series, which posits what Rhode Island’s political landscape would look like if we had switched to a mixed-member proportional representation (MMP) system in 2002. Part 11 (a revisiting of the 2010 election based on gubernatorial results) is available here. Part 13 discusses other electoral reforms.
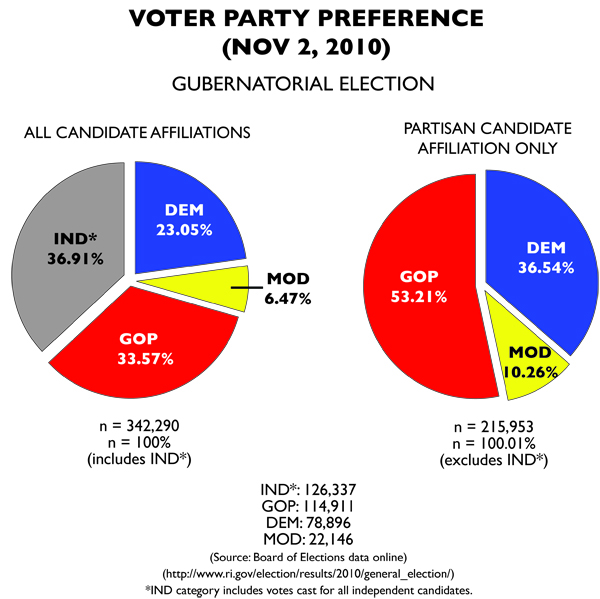
Because of the problem with the districts, let’s take a step back and look at the 2010 election again. The 2010 election is unique, because it features two statewide races with Moderate Party candidates. The first race, the gubernatorial election, is atypical. It features a well-known independent and a weak Democrat combined with this third party candidate and a somewhat typical Republican challenger. The second race, for Attorney General is slightly less atypical, with a winning Democrat, a Republican challenger, and a Moderate, plus two independents who do reasonably well.
The reason I’m focusing on these races is because they might give us an idea about what an MMP election might look like in Rhode Island with a party list vote. If you’ll remember, when MMP elections don’t rely on district results, there’s a separate ballot question asking what party a voter prefers. It’s like a statewide election for party, with the effect that it’ll change the party proportions in the chambers.
Let’s look at the gubernatorial election.
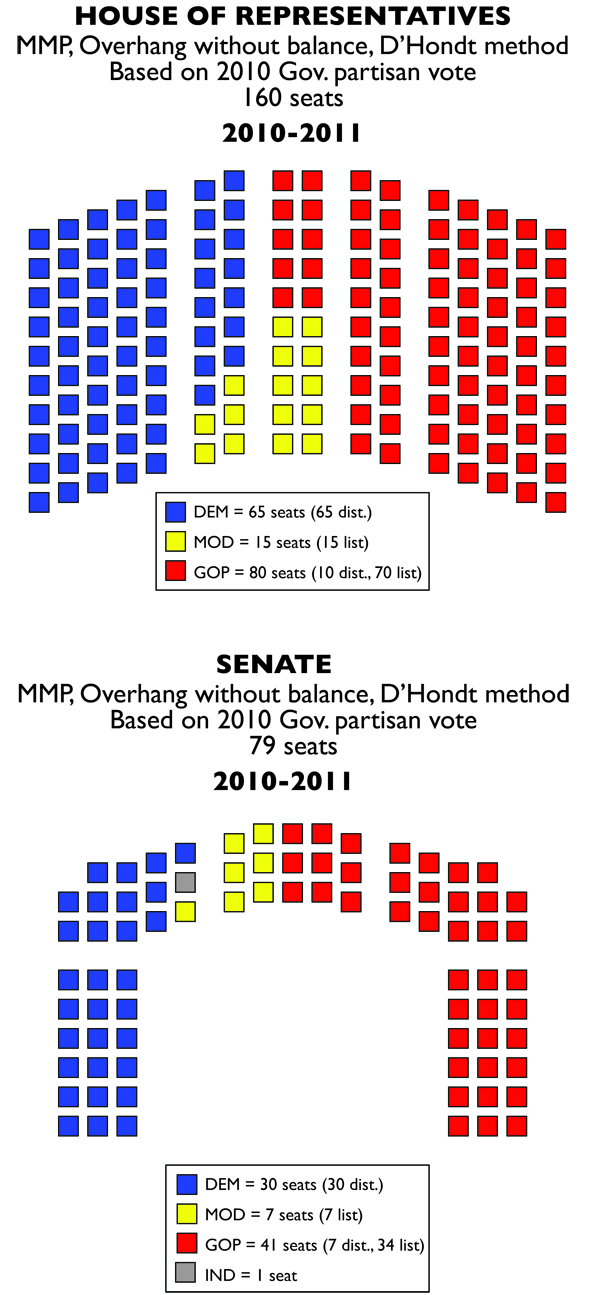
2010 MMP Election Using Gubernatorial Results
Voter percentages from 2010. DEM = Democratic Party, GOP = Republican Party, IND = Independent, MOD = Moderate Party. Due to rounding, not all percentages will add up to 100% (via Samuel G. Howard)
I like to think of this as the worst-case scenario for Democrats. First, I’ve removed all the independent voters, simply because it’s hard to simply declare they’d go to the Democratic Party. This means we’re looking solely at the votes that the Democrats, Republicans, and Moderates received. And there weren’t that many for Democrats.
Once again, the districts favor the Democrats. They win handily there, 65 seats in the House and 30 seats in the Senate. However, they have a terribly weak performance in the party list vote. In our alternate history version, we might speculate that in 2010 the depressed turnout of Democratic voters combined with Republican enthusiasm to increase the percentage of Republican votes.
The results in the districts allow Democrats to retain power disproportionate to what the D’Hondt method gives them. The D’Hondt method awards 55 seats to the Democrats in the House, but they win 65 in the districts. That means no one from their list makes it into the House. Republicans have a different result, with 7 out of 8 of their representatives from the list.
Both chambers result in overhang thanks to institutional Democratic advantage and the presence of Sen. O’Neill. What this leaves us with is a House with a Republican plurality (exactly 50%) and a Senate with a slight Republican majority. It’s impossible for either of the two biggest parties to form a veto-proof majority without being joined by many members of other parties. In the House, at least, there needs to be a coalition leadership team. It’s either a Republican-Moderate coalition which fails to give a veto-proof supermajority, or it’s a Grand Coalition between Democrats and Republicans. So it’s probably going to be the former, but the longer MMP lasts, the more likely the latter might get (difficult as it is to imagine now).
In many ways, this is not a good position for the Moderates (despite the fact they’re in the General Assembly). Being a junior member of a coalition is a troubling position to be in, especially when much of the Moderate brand is attempting to say that they’re not Republicans (witness the Liberal Democrats in the UK). On the other hand, should they refuse to sign a coalition agreement in the House, it’ll be easy to portray them as being responsible for that chamber’s instability.
And instability ultimately seems likely to happen. With slim majority control in one chamber and a coalition in the other, Republicans would be forced to find the broad consensus in their decision-making very quickly. It’s a lot easier to whip 10 representatives than to whip 80, and Republicans have never had to whip a majority of a chamber to pass legislation since they last were in power. They’d have to learn fast.
Part of what makes the Democratic Party so effective in its control of the General Assembly is that it usually knows how to shunt aside irrepressible dissenters and how to bring along just enough people to have a large majority. This is what made the failure of the pension amendment to the budget such a surprise. The Democratic leadership doesn’t get blindsided, they blindside others.
Those effective masters of parliamentary maneuver don’t disappear either. They’d be out there causing trouble for Republicans. And with so many new legislators in their caucuses, Republicans would have a hard time keeping any dissenters from breaking ranks.
RI GA apportioned according to the D’Hondt method using 2010 Gubernatorial results. (via Samuel G. Howard)
This is Part 11 of the MMP RI series, which posits what Rhode Island’s political landscape would look like if we had switched to a mixed-member proportional representation (MMP) system in 2002. Part 10 (a discussion of limitations) is available here. Part 12 is another look at the Election of 2010 using the Attorney General results.
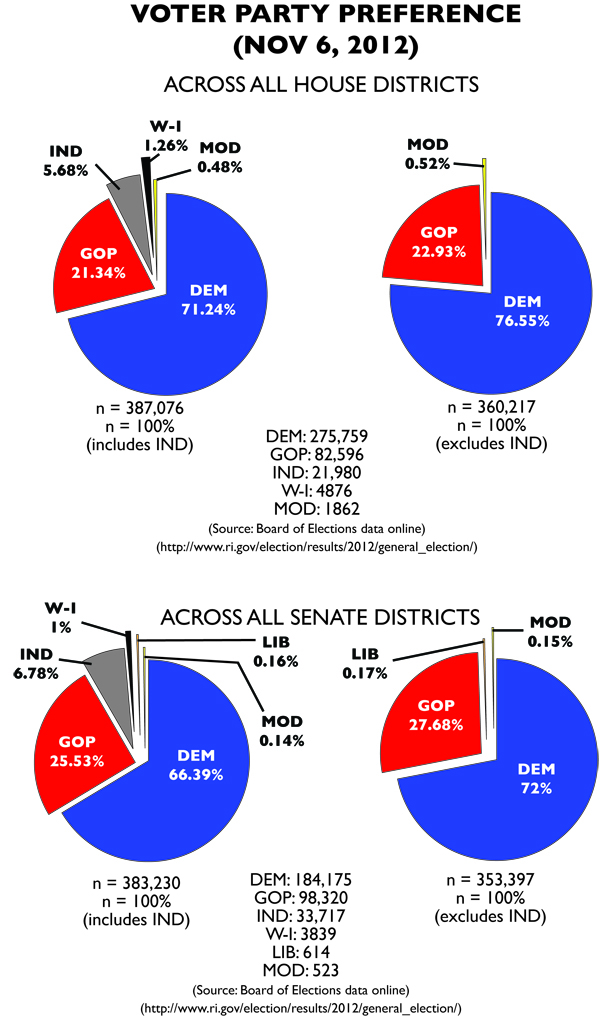
Voter percentages from 2010. DEM = Democratic Party, GOP = Republican Party, IND = Independent, MOD = Moderate Party, LIB = Libertarian Party, W-I = Write-In. (via Samuel G. Howard)
Nationally, Barack Obama was campaigning for a second term. Democrats were convinced they would win, while Republicans were convinced they would win. While Rhode Island was a sure thing, the chance to vote for President increased turnout to historic proportions.
This was bad news for the Republicans and Moderates in the General Assembly. Democratic voters completely overwhelmed their candidates, and many General Assembly candidates never faced opposition in the general election. State Republican Party chairman Mark Zaccaria’s “quality over quantity” strategy was especially foolish in this environment. Republicans actually lost votes from 2010, as many voters were denied the ability to select a Republican for General Assembly at the polls.
The Moderates were unable to hang on to their two seats. Though they finally contested the Senate, they pulled fewer votes than in 2010, and the Democratic tide significantly increased the hurdle to receive seats under the apportionment method. They were less successful than the Green Party had been in 2004, and the Greens lacked the institutional advantage of being a recognized party.
Democrats also avoided a repeat of the Montalbano episode in the House, as Speaker Gordon Fox held off independent challenger Mark Binder. Fox would now preside over a delegation of 109 Democrats, while his Senate counterpart President M. Teresa Paiva Weed would have 55 Democrats. Once again, the Democratic Party had its veto-proof supermajority.
Implications
2012 burst the Republican balloon, especially after conservative media predicted a blowout for Mitt Romney. National Republican obstinacy seems like it may have convinced a large number of Democrats that it’s not a safe thing to stay home. The other thing is that 2012 brought Democratic voters out at levels about what one would expect in a presidential election year. But Republican voters appear at rates just slightly better than 2006; their worst election.
Part of this really is attributable to the lack of competition. As I’ve said before, challenger apathy effects both sides roughly equally, with an advantage going to Senate Democrats. Zaccaria’s strategy of not spending resources on races Republicans can’t win sort of ignores the fact that there’s really little data about what races Republicans can win that they don’t already have a solid lock on. Senate Minority Leader Dennis Algiere regularly racks up around 11,000 votes in his usually uncontested general elections, making him one of the Senate’s highest vote-getters. House swing districts like 71 and 72 (held by right-wingers Dan Gordon and Dan Reilly, respectively) returned lefty Democrats in 2012; in the case of 71, Republicans failed to even put up a challenger.
In an MMP election where the district results are tied to your party’s seat total, failing to run candidates can have a very disastrous effect. A few hundred write-in votes are nothing compared to the huge amount of votes incumbents get. In a purely FPTP system like we have now, it also deprives Republicans of the ability to point out how popular their ideas are statewide. Part of this is because their ideas really aren’t so popular. In this case, it’s actually better for Republican self-image to automatically lose a third of all races and then complain about voters voting for Democrats. In far too many races, voters didn’t have a choice.
RI GA apportioned according to the D’Hondt method. (via Samuel G. Howard)
This is Part 9 of the MMP RI series, which posits what Rhode Island’s political landscape would look like if we had switched to a mixed-member proportional representation (MMP) system in 2002. Part 8 (the Election of 2010) is available here. Part 10 is a look at the limitations of this series.
Deprecated: Function get_magic_quotes_gpc() is deprecated in /hermes/bosnacweb08/bosnacweb08bf/b1577/ipg.rifuturecom/RIFutureNew/wp-includes/formatting.php on line 4387
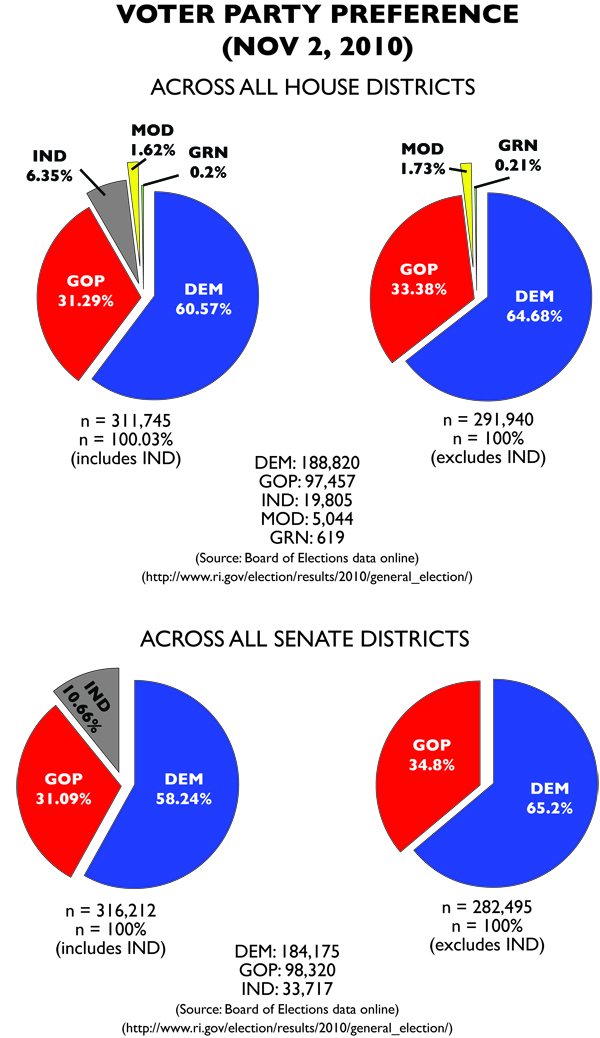
Voter percentages from 2010. DEM = Democratic Party, GOP = Republican Party, IND = Independent, MOD = Moderate Party, GRN = Green Party. (via Samuel G. Howard)
President Obama’s first term had devolved into the massive bungling of the Affordable Care Act. Republican intransigence in Washington combined with Obama’s refusal to stake out positions for his healthcare reform left Democratic partisans confused and disheartened. Meanwhile, Republicans were rallying against any change, and they had fired themselves up into a new movement, the Tea Party.
In Rhode Island, the situation was more confused. While the Republicans had nominated outgoing Gov. Carcieri’s senior communications advisor, the Democrats had selected General Treasurer Frank Caprio. Meanwhile, Ken Block was running at the top of the ticket for Rhode Island’s newly minted third party, the Moderates. But the candidate who had the most name recognition was former US Sen. Lincoln Chafee.
Since his defeat in 2006, Chafee had unaffiliated and back Barack Obama’s election in 2008. He would go on to narrowly win the Governorship, after Caprio insulted the President and it made national news. Staunch Democratic voters were left with little choice but to choose Chafee, the man they had rallied to defeat merely four years before.
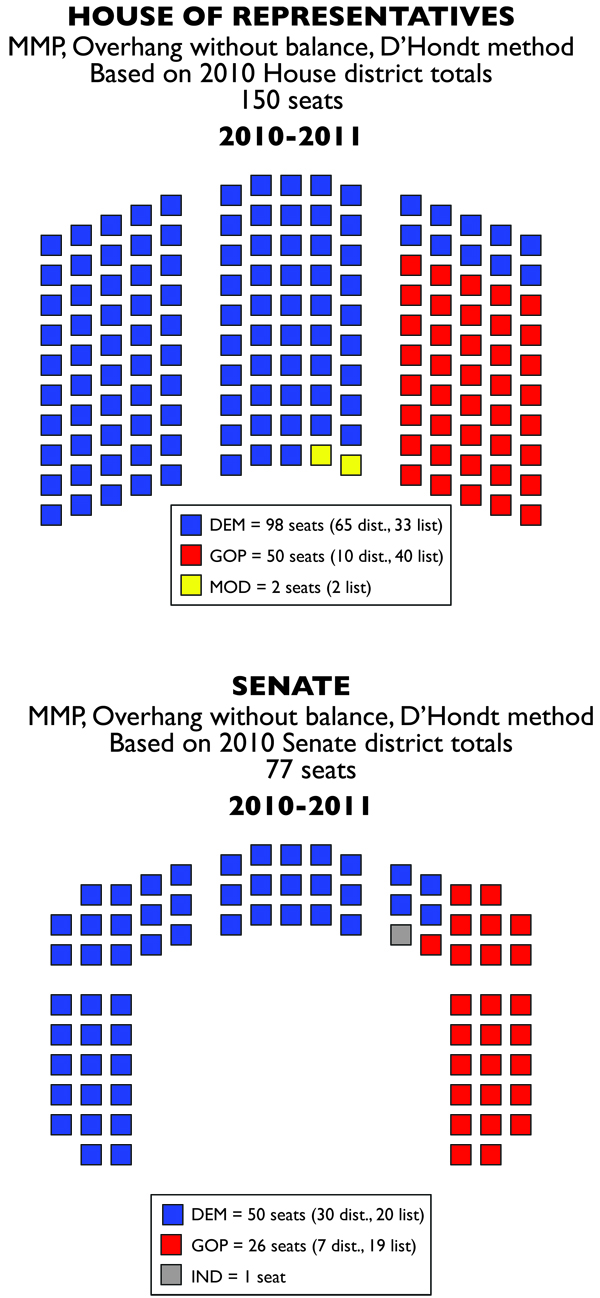
The key issue that would effect apportionment of the General Assembly were the Moderate candidates for the House. While they captured only 1.62% of the vote for House candidates, this meant they had enough to gain two seats in that chamber from their list. For first time possibly since the 1850s, a party other than the Democrats or Republicans had access to the most powerful part of Rhode Island government. Democrats also lost their veto-proof supermajority in both chambers.
Those gains came at the expense of Democrats, who lost 10 seats, with two going to the moderates, and eight going to the Republicans. Republicans managed to gain three seats from the districts as well.
In the Senate, Democrats lost six seats to the Republicans, four of which were from districts. Observers attributed the success to an abundance of general election races in the districts, though noted that much of those contests were due to independent candidates.
Implications
The 2010 election is the most interesting to me (after 1996’s Year of the Cool Moose), and it’s one I’ll return to later, but mainly because it features two statewide races with a third party candidate in it. The other thing is the nature of the Republican gains.
Even in real life, Republicans managed to increase their seats by 100% in the Senate and 50% in the House. The gains are less stunning in MMP, but still significant. And the primary reason wasn’t GOP motivation. Take the 2004 and 2006 elections for Democrats. Democrats won in 2006 (in the MMP version of events) due to a combination of Democratic fervor and Republican apathy.
For Republicans in 2010, their gains were almost completely due to Democratic apathy. While collectively, Republicans shed around 3000-10,000 votes, Democrats collectively lost over 90,000. These missing Democratic voters are what give the Republican Party gains, and why in the MMP version, the Moderates are able to enter the House. The Tea Party is really overblown in RI, because 2010 isn’t an election where the right wing rises up, it’s one where the left wing stays home.
The other thing to consider is that 2010 is the election in which the fewest candidates are without a challenger in the general election. It’s stating the obvious, but it’s impossible to beat an incumbent when no one runs against them.
2010 also lends credence to the idea that the way towards a healthy opposition to the Democratic Party in Rhode Island is not from the right as the Republicans and Moderates are trying, but rather from the left. A coordinated statewide campaign that effectively played on the disappointment many Democratic voters have had with the spinelessness of Democratic politicians could reap unexpectedly large dividends.
Alternatively, if Republicans wanted to win, they actually might benefit from a campaign that preyed on this disappointment to drive down Democratic turnout.
RI GA apportioned according to the D’Hondt method. (via Samuel G. Howard)
This is Part 8 of the MMP RI series, which posits what Rhode Island’s political landscape would look like if we had switched to a mixed-member proportional representation (MMP) system in 2002. Part 7 (the Election of 2008) is available here. Part 9 is a look at the Election of 2012.
Deprecated: Function get_magic_quotes_gpc() is deprecated in /hermes/bosnacweb08/bosnacweb08bf/b1577/ipg.rifuturecom/RIFutureNew/wp-includes/formatting.php on line 4387
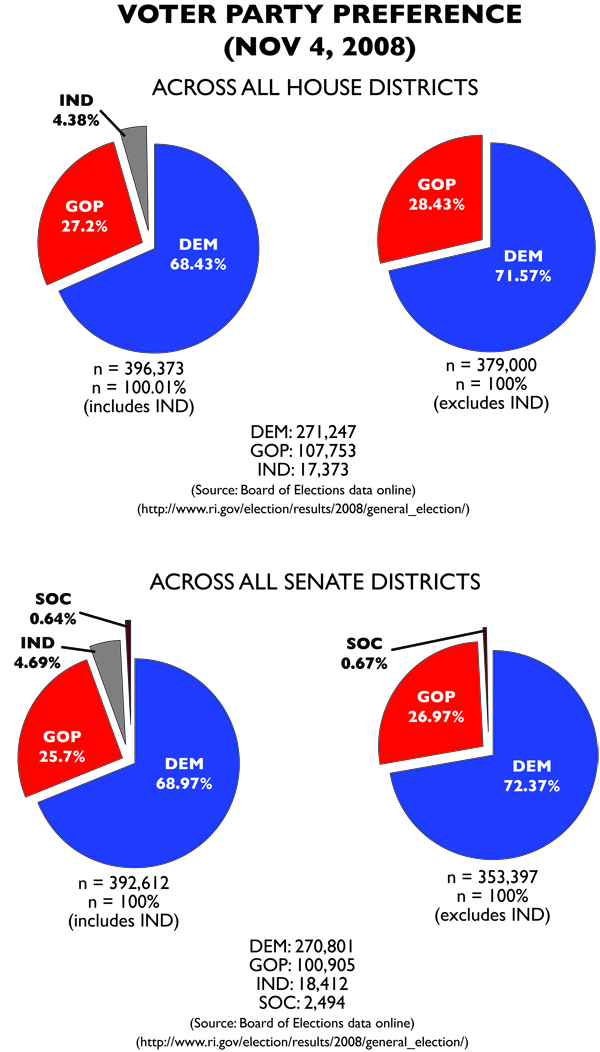
Voter percentages from 2008. DEM = Democratic Party, GOP = Republican Party, IND = Independent, SOC = Socialist Party. (via Samuel G. Howard)
The 2008 election promised more bad news for the Republicans. Their nominee for President, US Sen. John McCain of Arizona, wasn’t particularly well-liked by his party’s base. While attempting to shed his “maverick” image (while at the same time attempting to play it up), McCain stumbled badly by adding half-term Gov. Sarah Palin to the ticket. Palin quickly became more popular than McCain, while at the same time becoming an anathema to moderates and liberals; ostensibly McCain’s strength lay in the idea he could appeal across the political spectrum.
In the face of this, Sen. Barack Obama was a stark contrast. His election would make a historic first of America’s first non-white president. Furthermore, he was intelligent, and a stirring orator. Obama was also the beneficiary of a large number of young voters, while he’d proven in his nomination fight he could defeat establishment political figures like Hillary Clinton. On top of NGP VAN, Obama was also establishing a new set of tools to improve campaigning, building a technological infrastructure that would serve to advantage the Democrats.
Finally, on top of all this, in September of 2008, the United States and the world suffered the worst economic catastrophe since the Great Depression. Americans have turned to the Democratic Party in times of economic peril since the Great Depression, and this year was to be no different.
However, Rhode Island’s General Assembly results were not as triumphant for the Democrats as one would expect in a presidential year favoring Democrats. Democrats actually lost 4 seats in the Senate and merely gained one in the House. Among the seats lost in the Senate was Senate President Montalbano’s, which was won by a political independent, Edward O’Neill.
O’Neill’s victory forced the General Assembly to exercise its overhang rules, meaning that one Democrat would become an extra seat. The Senate would now have 77 seats.
Though the results left the Democrats with a supermajority, Republicans were keen to portray it as a victory. In the face of stunning pressure, they’d managed gains.
Implications
2008 worked as a year of gains for the Democrats, who managed to continue an increase in turnout. While it didn’t match the upswing in votes for Republican candidates, it was enough to allow the Democrats to make a gain of seven seats in the House and take a Senate seat from Republicans while losing Montalbano’s. The MMP election shows why that seems out of sync with how we’d expect the results to shake out.
Something noteworthy in the 2008 election is that Republican Senator Francis Maher faced a Socialist Party candidate. That Socialist won nearly 2500 votes in a district that Democrats normally failed to even mount a challenger in.
RI GA apportioned according to the D’Hondt method. (via Samuel G. Howard)
This is Part 7 of the MMP RI series, which posits what Rhode Island’s political landscape would look like if we had switched to a mixed-member proportional representation (MMP) system in 2002. Part 6 (the Election of 2006) is available here. Part 8 is a look at the Election of 2010.
Deprecated: Function get_magic_quotes_gpc() is deprecated in /hermes/bosnacweb08/bosnacweb08bf/b1577/ipg.rifuturecom/RIFutureNew/wp-includes/formatting.php on line 4387
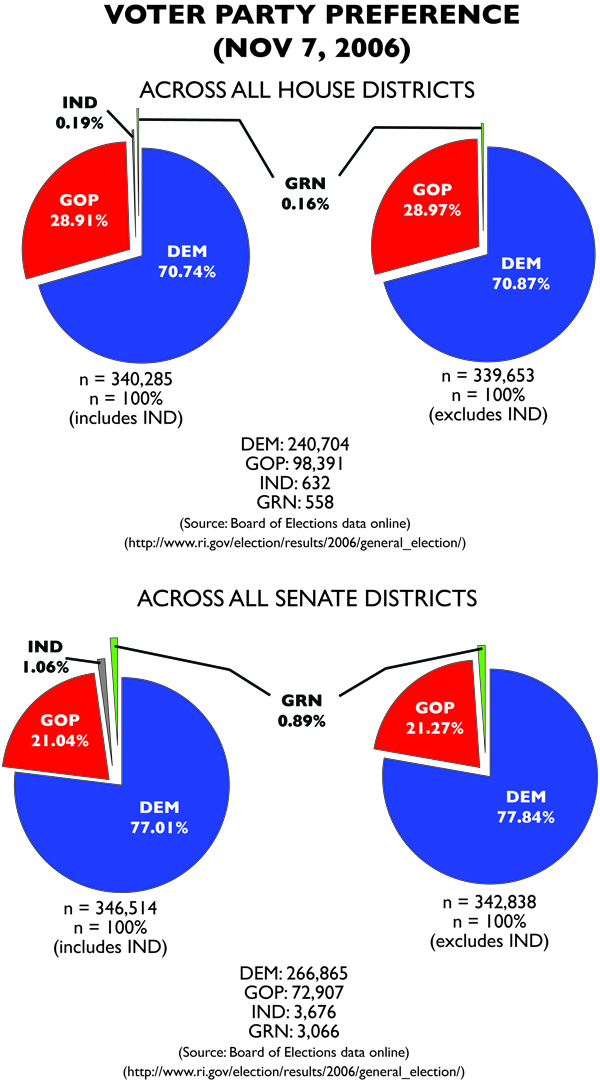
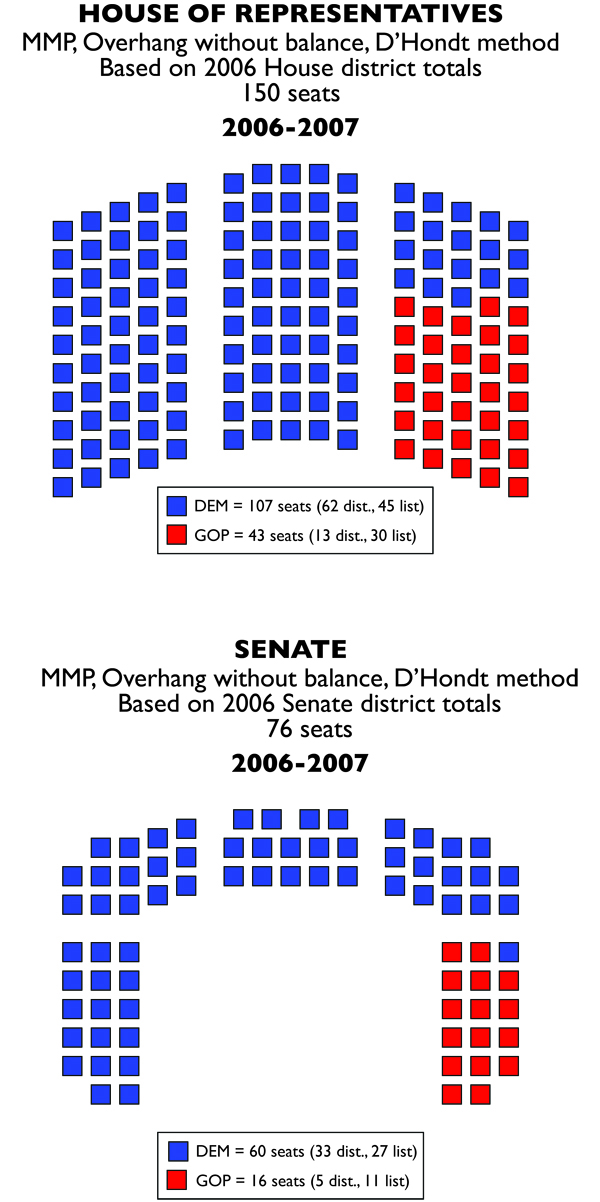
Voter percentages from 2006. DEM = Democratic Party, GOP = Republican Party, IND = Independent, GRN = Green Party. (via Samuel G. Howard)
Nationally, the Bush Administration’s bungling of immigration reform and the ongoing failure to end the Iraq War (while the falsification of the cause for war was becoming apparent) had made the Republican Party toxic. At the same time, Howard Dean’s chairmanship of the Democratic Party began institutionalizing data collection for the party via NGP VAN. Democrats were vitalized to throw the Republicans out of power, ending GOP dominance in Washington since the Contract With America.
In Rhode Island, Republicans further weakened incumbent US Senator Lincoln Chafee by primarying him with right-winger Stephen Laffey. When combined with the anti-Republican fervor sweeping the country, he went down against former RI Attorney General Sheldon Whitehouse.
Gov. Donald Carcieri narrowly won reelection over Lt. Gov. Charlie Fogarty, and as usual, the whole slew of general officers below the gubernatorial level were returned as Democrats.
Low Republican turnout meant gains for Democrats in the GA. Close to 50,000 fewer people voted Republican in Senate races than in 2004, while around 30,000 fewer people voted Republican in House races. Combined with a failure to contest district seats, and Democrats saw significant gains. Democrats gained 10 seats in the House and nine seats in the Senate; with Republicans losing the equivalent.
Republicans complained about the master lever costing them votes. Democrats smiled.
Implications
In real life, this was not actually as stunning a shift. In an MMP election, the shifts are 10 seats in the House, 9 in the Senate; all to the Democrats. In reality, Democrats held steady at 33 seats in the Senate, and only gained two seats in the House. What’s even more stunning to me is that while votes for Republican candidates completely collapsed, Democrats actually boosted their turnout over 2004, which defies the common wisdom of “presidential election years favor Democrats because of high turnout.”
Interestingly enough, the vote for independent candidates completely cratered at this point, with House independents only receiving a combined 0.19% of the vote. In 2008, it would soar to the heights it’s achieved in the last three elections.
RI GA apportioned according to the D’Hondt method. (via Samuel G. Howard)
This is Part 6 of the MMP RI series, which posits what Rhode Island’s political landscape would look like if we had switched to a mixed-member proportional representation (MMP) system in 2002. Part 5 (the Election of 2004) is available here. Part 7 is a look at the Election of 2008.
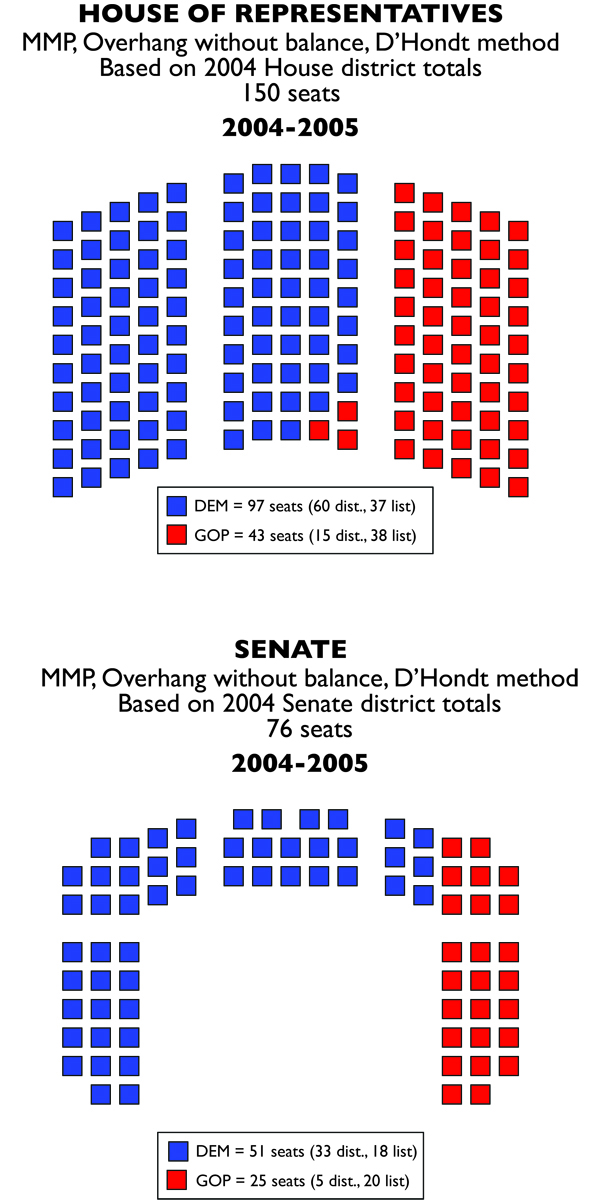
Voter percentages from 2004. DEM = Democratic Party, GOP = Republican Party, IND = Independent, GRN = Green Party, W-I = Write-In. Some percentages add up above 100% due to rounding. (via Samuel G. Howard)
Turnout was expected to be high in a presidential election year. The Iraq War, which had seen a nation toppled in less than a month, was entering a bloody phase. In April, the US Marines had been defeated at Fallujah, almost exactly a year after President Bush had declared “Mission Accomplished” aboard the USS Abraham Lincoln. Sen. John Kerry of Massachusetts attempted to hold Bush to one term, in a divisive election that helped solidify the idea of a “red state-blue state” divide in America.
Though Rhode Island was decisively a blue state, a dispute between Providence’s firefighters and Mayor Cicilline prevented Vice Presidential candidate John Edwards from visiting Rhode Island, as he refused to cross the union picket line.
In the General Assembly, Democrats lost seats, even as they won a new seat in Senate. Republicans seized upon that seat gain to suggest that redistricting was a problem; how had Democrats managed to gain a new district seat if their share of the votes had gone down? Democrats countered with the fact that a renewed emphasis on contesting seats had yielded the Republican four new district seats, defeating four Democrats in head-to-head races. Perhaps if Republicans focused on running instead of complaining, they might do better.
In total, Republicans gained two seats in the Senate and five seats in the House. Republicans told their members they were doing better, and the end of Democratic control was coming soon. Democrats grumbled.
Implications
In reality, though the Republicans gained four seats in the House, they actually lost a seat in the Senate. 2004 was the high watermark for Republican turnout, not as a percent wise, but total votes. In both House and Senate races, over 120,000 people cast their votes for Republican candidates. Collectively, Republican candidates tend to must 30,000 to 20,000 votes less. Though Republicans managed to turnout in large numbers, Democrats turnout in even higher numbers, improving somewhere around 40,000 voters over 2002.
RI GA apportioned according to the D’Hondt method. (via Samuel G. Howard)
This is Part 5 of the MMP RI series, which posits what Rhode Island’s political landscape would look like if we had switched to a mixed-member proportional representation (MMP) system in 2002. Part 4 (the Election of 2002) is available here. Part 6 is a look at the Election of 2006.
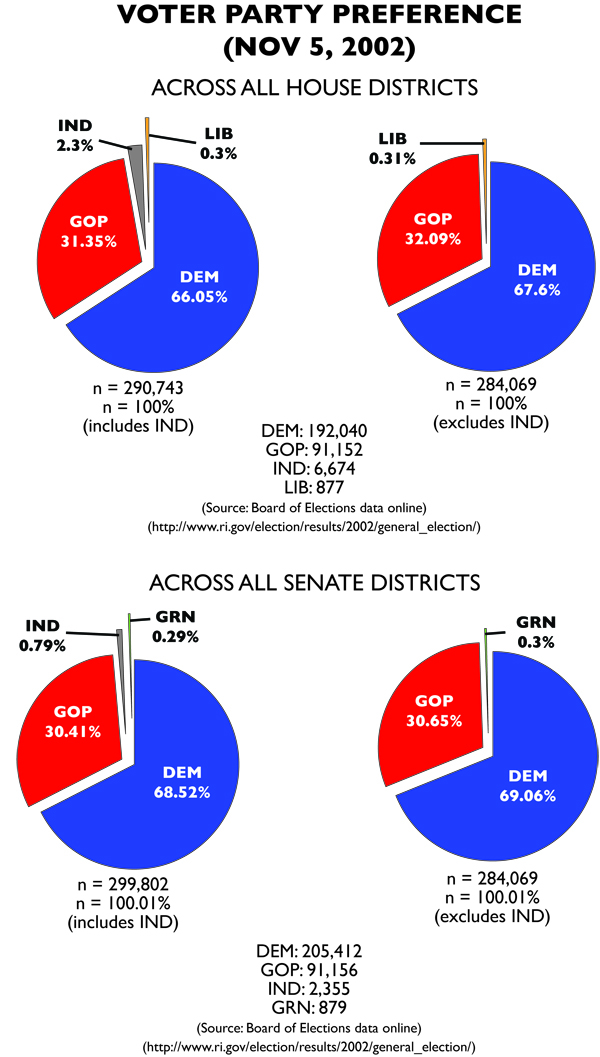
Voter percentages from 2002. DEM = Democratic Party, GOP = Republican Party, IND = Independent, LIB = Libertarian Party, GRN = Green Party. Some percentages add up above 100% due to rounding. (via Samuel G. Howard)
2002 was a momentous year for Rhode Island politics. State Representative David Cicilline announced he would challenge Buddy Cianci for Mayor of Providence. The capital city was also seeing a coalition of left-wing voters working to elect a young Green Party candidate David Segal to the city council. The major battle was between liberal standard-bearer former state Sen. Myrth York and conservative businessman Donald Carcieri.
In this atmosphere of change, so too was the General Assembly changing. Though its number of districts had been downsized, nearly a decade prior voters had approved an expansion of the Assembly; both chambers would practically grow by half.
The results of the election were stunning. Carcieri triumphed over York, who underperformed among Democrats. Cianci was eliminated before election day after being found guilty of racketeering conspiracy; after overcoming a primary election, Cicilline cruised to victory. Segal entered the Providence City Council as the minority leader, the sole member whose party wasn’t “Democrat”.
And in the General Assembly, the change was hard to interpret. Certainly, neither party “lost” seats. And yet, proportionally, the Republicans were stronger than they would have been in the old FPTP system. Instead of controlling a mere 14.67% of the seats in the House, they controlled 32% of the seats. In the Senate, the old way would’ve seen them earn 15.79% of the seats. The new method assigned them 30.26% of the seats.
However, the vast majority of Republican seats were from the party list, not from districts. Failure to contest as many seats meant that their candidates were more beholden to party, rather than to constituency. The Democrats had the opposite issue; their victory in the districts meant that they assigned fewer from the lists. The Democratic delegation would be mostly made up of incumbents, while the new Republicans would be mostly fresh-faced.
The Republicans claimed victory. Here was proof that Rhode Island’s corrupt system had prevented the full choice of the voters from being acknowledged. Democrats, for their part, grumbled, and went home with a slim supermajority of the General Assembly seats.
Implications
In reality, Democrats controlled roughly 85 percent of each chamber. Republicans were essentially shunted aside, even while winning slightly less than a third of the vote. So they controlled half of what they should have in the Assembly proportional to the votes they received.
In retrospect, it seems odd that the impetus for the General Assembly being shrunk was to create greater competition for seats. Mainly, because it failed to work; about a quarter of Senate seats were uncontested (10) as were a third of House seats (34).
RI GA apportioned according to the D’Hondt method. (via Samuel G. Howard)
This is Part 4 of the MMP RI series, which posits what Rhode Island’s political landscape would look like if we had switched to a mixed-member proportional representation (MMP) system in 2002. Part 3 (an explanation of MMP and an account of the methods used to create these posts) is available here. Part 5 is a look at the Election of 2004.
Deprecated: Function get_magic_quotes_gpc() is deprecated in /hermes/bosnacweb08/bosnacweb08bf/b1577/ipg.rifuturecom/RIFutureNew/wp-includes/formatting.php on line 4387
The first time I ever voted in a general election, I was down in North Carolina. A few weeks before Election Day, I had lined up a friend to drive me to the polls (Greensboro, NC is a very car-centric city, and no friend to the public transportation user), but health reasons prevented me from making it to the polls that weekend.
If that had been the only day I could’ve gone to vote, that would’ve been it. I would’ve missed my window of opportunity, and never would’ve cast a vote in 2008. Luckily, the Tar Heel State, despite its weird nickname, had implemented early voting under a previous legislature (early voting has since been reduced under the Republican legislature elected in 2010). I went the next week and cast my vote in a reasonably long line.
There’s no sensible reason to hold Election Day just on a Tuesday (especially given it’s not a day off). And there’s no sensible reason elections can’t take place during a far longer period.
Good thing the Democratic Party chairman understands that. In fact, in a letter to the editor that ran in The Providence Journal, Chairman Edwin Pacheco lays out a pretty simple list of changes; some of them changes of the changes that were just made to voting procedure. Early voting is the first thing. Others include:
Returning poll closing times to 9:00 PM rather than 8:00 PM.
Returning poll locations to serving only 1900 voters rather than 3000.
Review the Board of Elections.
Allow the Secretary of State to nominate BoE board members and its executive director, or else allow the Secretary to serve as an ex-officio member.
If this is, as many observers suspect, an opening salvo in Mr. Pacheco’s run for Secretary of State, it’s a pretty good one. If the other Democratic candidates have policy offerings of this caliber, we might actually have a really great campaign about election issues leading up to Primary Day. And though it’s not exactly a make-or-break issue, how we manage and control our elections can be really important. Case in point, you used to have tear your ballot out of the newspaper, and it’d be colored in favor of one candidate or another, meaning everyone could see who you were voting for as you walked down the street.
Deprecated: Function get_magic_quotes_gpc() is deprecated in /hermes/bosnacweb08/bosnacweb08bf/b1577/ipg.rifuturecom/RIFutureNew/wp-includes/formatting.php on line 4387
Deprecated: Function get_magic_quotes_gpc() is deprecated in /hermes/bosnacweb08/bosnacweb08bf/b1577/ipg.rifuturecom/RIFutureNew/wp-includes/formatting.php on line 4387
Deprecated: Function get_magic_quotes_gpc() is deprecated in /hermes/bosnacweb08/bosnacweb08bf/b1577/ipg.rifuturecom/RIFutureNew/wp-includes/formatting.php on line 4387
Deprecated: Function get_magic_quotes_gpc() is deprecated in /hermes/bosnacweb08/bosnacweb08bf/b1577/ipg.rifuturecom/RIFutureNew/wp-includes/formatting.php on line 4387
Deprecated: Function get_magic_quotes_gpc() is deprecated in /hermes/bosnacweb08/bosnacweb08bf/b1577/ipg.rifuturecom/RIFutureNew/wp-includes/formatting.php on line 4387