Legislature Wanted to Force Cities to Cut Taxes


Deprecated: Function get_magic_quotes_gpc() is deprecated in /hermes/bosnacweb08/bosnacweb08bf/b1577/ipg.rifuturecom/RIFutureNew/wp-includes/formatting.php on line 4387

Deprecated: Function get_magic_quotes_gpc() is deprecated in /hermes/bosnacweb08/bosnacweb08bf/b1577/ipg.rifuturecom/RIFutureNew/wp-includes/formatting.php on line 4387

June in Rhode Island means two things: ripe strawberries and gubernatorial vetos.

The silly way our legislature schedules things — with all important bills held until after the budget passes to ensure every legislator falls into line on that vote — means that hundreds of bills are passed in the last few days of the legislative session. This then means they all await the Governor’s signature after the session ends. And some of them get a veto instead.

My favorite veto so far this year was of a bill that would provide a tax break… at someone else’s expense. Sponsored by Representative John McCauley (D-Providence) in the House, and Senators Michael McCaffrey (D-Warwick) and Erin Lynch (D-Warwick) in the Senate, the bill would exempt from the property tax any new construction before it was issued a certificate of occupancy.

The collapse of the housing bubble has meant a real collapse in construction employment. Unemployment among construction workers is almost certainly much higher than the already way-too-high general rate lurking around 11%. It’s natural to think that the industry could use some help. But is it natural to demand that someone else provide it?

Essentially what this bill’s sponsors hoped would happen is to stimulate the construction industry by giving developers a break on property taxes collected by a city or town. One can applaud the motivation while still thinking that the concept is pretty weak.

First of all, it’s not at all clear that this would have a stimulative effect. How many developers are dissuaded from investing by the potential risk of having to pay taxes on property before it’s occupiable?  Might not the lack of buyers be a bigger disincentive?

Second, how dare these legislators pile on to the cities and towns? This is a bill that would actually take tax revenue away from many municipalities. Do they not read the news?  Are they not aware that we now have three cities in financial trouble, with more on the precipice?  In what way exactly would this help those cities?

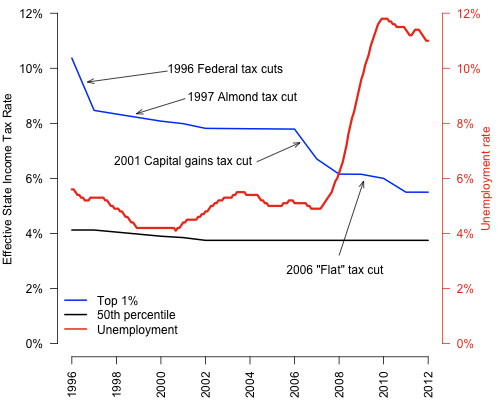
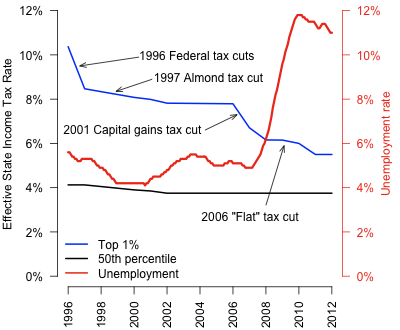
To be honest, this is hardly that unusual. After all, it’s almost traditional in the General Assembly to ignore or hide the cost of tax cuts. I can’t think of a single substantial tax cut over the past 20 years that passed the Assembly with offsetting cuts to services. In fact, the tradition is not only to avoid paying for tax cuts, but to vote to phase them in over several years so the real costs are hidden during the budget year they are debated. This was true of the 1997 income tax cut, the 1997 car-tax cut, the 2006 flat-tax cut, and the 2001 capital gains cut, which didn’t even take effect until five years after it passed.

So does this mean unemployed construction workers are out of luck? Probably it does, but not because there is nothing to be done. They are out of luck because the people who can do something choose not to. The General Assembly leadership feels that keeping state revenue down is more important than helping cities and towns. Three years ago municipal budgets across the state were vandalized when the state withheld part of that fiscal year’s state aid payment. Then they did it again the next year, and the next. Between fiscal year 2008 and 2010, the state withheld what amounted to about 10% of Providence’s non-school budget, and millions more for each other municipality.

Admittedly, the state saw its own revenues plunge in 2008, as the income and sales taxes both skidded down in the recession, accelerated by big tax cuts for rich people during each of the years 2007-2011. But the recession and the cuts are over, and revenue in the current fiscal year looks like it will end well ahead of last year’s projections. You might think that would allow us to restore the tax cuts and thereby restore the municipal aid cuts of the previous years, but apparently not. Or you might think we could engage in some small local stimulus, perhaps by accelerating the scheduled repairs of our bridges, maintenance of state buildings, or maybe even re-hiring a few hundred teachers. Nope. Tax cuts are still the only thing on the menu at the state house.

So bravo for Governor Chafee. Bills like this deserve a veto and the legislators behind them deserve to be shamed.

Sewage Treatment Gets Legislative Treatment


Deprecated: Function get_magic_quotes_gpc() is deprecated in /hermes/bosnacweb08/bosnacweb08bf/b1577/ipg.rifuturecom/RIFutureNew/wp-includes/formatting.php on line 4387

Deprecated: Function get_magic_quotes_gpc() is deprecated in /hermes/bosnacweb08/bosnacweb08bf/b1577/ipg.rifuturecom/RIFutureNew/wp-includes/formatting.php on line 4387
State House Dome from North Main Street
The State House dome from North Main Street. (Photo by Bob Plain)

In the waning days of the legislative session, can one be forgiven for suspecting that Assembly members don’t give a, well how about a quart of  sewage solids about the municipal governments they represent?  Sewage stories from Woonsocket and Warwick lead one to suspect otherwise.

Woonsocket first. Woonsocket is currently under a DEM order to drive nutrient pollution down beginning in 2013. Nutrient pollution, in the form of nitrates and ammonia, acts as fertilizer for algae blooms that use up oxygen in the water, killing the fish that aren’t driven away. The estimated cost of these improvements is around $35 million.  The system serves Woonsocket, but also some customers in neighboring towns, on either side of the border with Massachusetts.  The estimate is that this will add a couple of hundred dollars to annual sewer bills.

Woonsocket’s now-infamous House delegation, Jon Brien, Robert Phillips, and Lisa Baldelli-Hunt, tried to get the DEM requirement killed during the last legislative session. Unfortunately, DEM is only enforcing a federal EPA requirement, so it’s more complicated than just yelling, “stop.”

Complicating the issue, upstream from Woonsocket, the sewage authority over the line in Massachusetts is suing the EPA over the same rules. The dodge currently preferred by the city of Woonsocket and their House delegation is that Rhode Island wait for the outcome of that suit. Though it might seem to make sense to wait for the suit to settle, similar suits around the country have failed. Besides, clean water is — to most people — a good thing. Might the delegation have proposed helping Woonsocket pay for the sewage treatment upgrades?

Move now to Warwick. The Assembly repealed a law to mandate that homeowners along the new sewer routes hook their houses up to those sewers.  A typical hookup costs $1500-2000, and annual sewer bills are around $450. The mandate is/was part of the Greenwich Bay Special Area Management Plan, a plan to clean Greenwich Bay, once home to a thriving shellfish fishery, and now mostly closed to digging clams.

Governor Chafee vetoed the bill and the Assembly overrode his veto. Another victory for low sewer bills. Except that the finances of the Warwick Sewer Authority have budgeted in a certain number of hookups per year. This is part of how they borrowed the money to fund the expansion in the first place, and how they make their budget each year. Without those new hookups, the people already connected to the sewer will see their rates rise, both according to the financial statements, and to Janine Burke, the Warwick Sewer Authority director, who I spoke to about it.

Alternatively, the Authority has the legal authorization to charge a fee — a “connect-capable” fee of around $200 per year — to the houses along its route that aren’t hooked up. To date it has chosen not to do so (which puts it out of compliance with the Greenwich Bay plan), but it can revisit the issue. At any rate, overriding that veto in order to keep sewer costs down seems like it may be a losing strategy.

What both of these stories say is that the state is interested in seeing cleaner water. The Assembly gave no orders that DEM repudiate the EPA requirements. No one will go on record wanting dirty water and dead fish. They just don’t want to pay for the cleanup.

To a small extent, you have to give the Woonsocket gang of three a little credit for consistency. They don’t think cleaner water is worth spending any money on, and so reject both the money and the requirements, even if they offer lip service to clean water. Lisa Baldelli-Hunt told the Woonsocket Patch:

“I understand it’s important to decrease the pollutants in the water and I also understand that eventually, this must happen. But we can’t possibly move forward with this project at this time and consider ourselves fiscally responsible leaders.”

So their position is clean water, later. The rest of the Assembly seems ok with the idea of clean water now, so long as someone else pays for it. Neither perspective seems worth endorsing to me.

What about the perspective that clean water now is a good thing worth paying for?  It’s a good thing for Woonsocket, but it’s also a good thing for everyone downstream, which means Lincoln, Cumberland, Pawtucket, Central Falls, Providence, and everyone on Narragansett Bay. Untreated sewage currently flows into the water from the Warwick shore, but East Greenwich benefits from a cleaner Greenwich Bay, too. Given all that, why should the state insist that all sewage problems be solved locally?  Yes, Woonsocket residents pay higher property taxes proportional to their ability than nearly any other city or town in the state.  Sewer customers in Providence and Pawtucket have seen their rates climb dramatically in recent years for the same reasons.  Does the state have nothing to offer besides words? How about money?

Let’s end with a riddle. In 2010, our state’s economy, measured by the gross state product, was about $49.2 billion dollars. Corrected for inflation, this is larger than it has ever been in our little state’s history, despite our monumental unemployment rate. There are those who say that our economic growth is because of the dramatic drop in tax revenue over the past decades. That’s silly because growth has slowed or stalled as taxes have been cut. But slow growth or fast, the economy now is bigger than ever.

So remember, when you hear about how we can no longer afford clean water or good education or comfortable retirements — let alone find enough jobs for everyone — that our state is collectively richer now than it has ever been before. Ever. Feel better now?

Legislature Ignores Public Transit in Budget


Deprecated: Function get_magic_quotes_gpc() is deprecated in /hermes/bosnacweb08/bosnacweb08bf/b1577/ipg.rifuturecom/RIFutureNew/wp-includes/formatting.php on line 4387

Deprecated: Function get_magic_quotes_gpc() is deprecated in /hermes/bosnacweb08/bosnacweb08bf/b1577/ipg.rifuturecom/RIFutureNew/wp-includes/formatting.php on line 4387

Who cares about buses? Apparently no one on Smith Hill.

The House Budget, to be voted on Thursday, contains not a penny in new revenue for RIPTA. It also contains no ideas, proposals, or signs that anyone in the House Fiscal staff spent more than a dozen minutes thinking about the agency. This is hardly surprising, since the Governor’s budget didn’t have anything to say about it, either. Despite several years of a funding crisis, RIPTA still struggles to get anyone’s attention.

This, of course, is also hardly surprising. No one in a position of authority actually rides the bus. The Governor doesn’t, the Speaker doesn’t, the Senate President doesn’t, even though the service from Newport to Providence is excellent, with over 60 buses traveling back and forth every day. There aren’t even any members of the RIPTA board who are regular bus riders, besides Anna Liebenow, who has MS and uses a wheelchair. Two current board members have told me they made a point to get on the bus once or twice after their appointment, but that’s not quite the same thing, is it?

This isn’t to say that no one rides the bus. RIPTA provided 26 million rides last year, which works out to serving between twenty and fifty thousand people every day. Over half of them are riding to and from work (like me). Lots of them own cars, which they leave at home to leave more room on the highway and more parking spaces for you.

And, of course, lots of them don’t own cars, or can’t drive, and the bus is their lifeline, the way they get around this state. But who cares about them?  In the halls of the state house, RIPTA is widely viewed as a program for poor people. Consequently it is a poor system, and it’s therefore socially acceptable in that world to ignore it. There are a couple of seats on its board designated for people who represent either poor people or disabled ones, and that’s pretty much that.

The House budget does provide for some capital investment to buy new buses, but that’s not RIPTA’s problem. Their problem is that a big part of their budget comes from the gas tax, and when gas prices rise, more people ride the bus and less gas is sold. Since the gas tax is a set number of pennies per gallon of gas (9.25 cents out of the 32 cent per gallon gas tax), when gas prices rise they get more riders at the same time they get less money. It’s a crazy way to fund the system, but that’s nothing new. Now, despite several years of three-dollar gas and full buses — standing room is not unusual on the lines I ride — there has been zero constructive action to fix the problem.

You should understand a couple more things about RIPTA. One is that compared to other similar sized systems, we get very good return for our dollar from the agency. Comparing rides provided per year to expenses, RIPTA comes out very well in head-to-head matchups with its peers around the country. The other is that to my knowledge, except for a one or maybe two subway lines in Japan, there aren’t any public transit systems anywhere in the world that don’t have a subsidy of some kind. Just as there aren’t any road systems who don’t require a subsidy. Public transit is a matter of public infrastructure and should be supported as such. We’re not talking about a mint.  RIPTA’s deficit is estimated at about $9 million at this point, a little more than one thousandth of the overall budget.

At the current deficit, and with no change at all, RIPTA has approximately half a year left before they can’t make payroll. This won’t happen, of course. What will happen is service cuts that will be devastating for everyone who relies on the bus. Without buses there will be around 10,000 more cars on Rhode Island roads every day, along with many more people than that cut off from jobs they travel to, or just unable to get around because they can’t afford a car — or because they can’t drive.

So come on, tell your Representative or Senator that we need public transit. (And do it today!)  We don’t need more buses without the money to run them. Call Helio Melo, the House Finance chair and tell him that just because he doesn’t ride the bus doesn’t mean that nobody does. Tell Gordon Fox that not everyone can afford a car. Tell Teresa Paiva-Weed that our state will be a cleaner, more pleasant place to live — and drive — with a healthy and well-funded bus system. We need more people on the bus, not fewer, and letting RIPTA choke on gas tax fumes is exactly the wrong direction for our state to be going.

As Legislature Spends Money, Cities Feel Pinch


Deprecated: Function get_magic_quotes_gpc() is deprecated in /hermes/bosnacweb08/bosnacweb08bf/b1577/ipg.rifuturecom/RIFutureNew/wp-includes/formatting.php on line 4387

Deprecated: Function get_magic_quotes_gpc() is deprecated in /hermes/bosnacweb08/bosnacweb08bf/b1577/ipg.rifuturecom/RIFutureNew/wp-includes/formatting.php on line 4387
Woonsocket High School (photo courtesy of Woonsocket School District)

I see from the Providence Journal that the new state-appointed budget commission has decided that the city council and Mayor Fontaine were exactly right to request permission from the state to impose a supplemental tax increase on their citizens.

Last week, after an impassioned speech by Rep. Lisa Baldelli-Hunt, the House rejected Woonsocket’s request.  This week, the state-appointed budget commission asked that the request be reconsidered.

For some reason state legislators seem to get this idea in their heads that though they were elected on promises of fiscal responsibility, and intend to carry through on them, city council members and mayors get elected by promising to spend like drunken sailors.

This is not only bizarre, but entirely backwards.

By almost any measurement you care to make, it’s the state that has been the fiscal problem child over the past couple of decades, not the cities and towns. The difference is that the state has power over the cities and towns: they have more money, and stand uphill in a legal and constitutional sense, too.  But the General Assembly continues to resist the appeals of the duly elected leaders of our cities and towns, feeling that they know better.

This year, Governor Chafee infuriated organized labor by offering several “tools” to municipal officials to help them control pension costs.  I tend to agree with the labor folks here, that the state should stay out of these issues, and that passing state laws to trump local bargaining agreements is only a good idea in a very limited short-term sense.  But the Assembly has shown no interest in believing Mayors when they complain about financial stress, so if you don’t want more bankrupt cities, what should you do?  It seems to me that Chafee wasn’t so much sticking his thumb in Labor’s eye as making a realistic assessment of the Assembly and acting accordingly.

Or maybe not.  It appears that the Assembly leadership isn’t interested in Chafee’s suggestions, and pretty much none of them were put into the House budget.  This reminds me of the time in 2005 when the Carcieri administration came up with some personnel reforms that might have saved around $32 million.  They were the usual sort of benefit cuts, limits on vacation time and sick time and an end to “statutory status” which is a kind of state employee tenure.

Whatever you think about the wisdom of those reforms, it’s hard to praise the Assembly for what happened next.  The legislature rejected the reforms — but left the $32 million in savings in the budget.  So the administration was faced with finding $32 million in savings, but without the law changes to do it.  How, exactly was that responsible?

So now the Assembly is poised to do the exact same thing, and act to increase the pressure on cities and towns — not enough money to support their commitments, but no relief from those commitments, either.  The only difference this year from previous years is that now we have some Assembly appointees joining the Mayors in the hot seat, begging that they not be put in the same position as the Mayor and City Council of Woonsocket.  Mayor Leo Fontaine and the Council have failed to keep Woonsocket solvent, but a new budget commission won’t do any better unless the conditions change.  Right now, the only way the conditions will change is through the bankruptcy court, so mark your calendars.  I simply can’t agree with the people who imagine that dragging each of our cities into bankruptcy is a sensible strategy — in either the long or short term — for our state.

The Assembly can act here.  Sensible options are available, that take into account the actual realities facing our cities.  But will it?  So far, it does not appear likely.

Budgeting for Disaster: Like What We’ve Got? Good


Deprecated: Function get_magic_quotes_gpc() is deprecated in /hermes/bosnacweb08/bosnacweb08bf/b1577/ipg.rifuturecom/RIFutureNew/wp-includes/formatting.php on line 4387

Deprecated: Function get_magic_quotes_gpc() is deprecated in /hermes/bosnacweb08/bosnacweb08bf/b1577/ipg.rifuturecom/RIFutureNew/wp-includes/formatting.php on line 4387

As has been amply reported by other writers here and in other places, the state budget has emerged from the mists of the Finance Committee, and will likely be voted on and passed this week. It contains no broad-based tax changes, though there are small increases in cigarette taxes, and small expansions of the sales tax, and tolls, to cover restoring 40% of the money cut from care to the developmentally disabled, and to fund the state’s education funding formula — the one that the legislature’s own study shows is inadequate. Due to more encouraging revenue projections than were the case last fall, some money has been restored to important places, but it’s just a bit here and there.

This graph is still the policy of the state:

That lower line is the effective tax rate on the median taxpayer. The blue line is the rate on the top 1%, and the red line is just thrown in there to show there is no relationship between taxes and unemployment.

The message overall from the legislature is that the cities and towns be damned. There seems no willingness to acknowledge that the fiscal crisis in the cities is largely the result of state policies. Tremendous cuts in state aid in 2008-2010 to both the municipal and education sides of city and town budgets brought fiscal havoc everywhere, and last week we had the spectacle of Lisa Baldelli-Hunt, a representative from Woonsocket, begging her colleagues in the legislature not to allow Woonsocket to fix the problems caused by her colleagues. Oddly enough, they complied, and now we have two more cities half a step from joining Central Falls in bankruptcy.

The sad fact is that by and large the people in charge of our cities and towns have actually been more fiscally responsible than legislators in the General Assembly, but they have less power, and so the Assembly leadership can pretend otherwise.

That’s quite a claim, isn’t it?  How to back it up?  How about this: as of 1990, Rhode Island cities and towns collected about $1.3 billion, between state aid, property taxes and various municipal fees. In 2008 — before the worst of the state aid cuts — they took in a bit less than $3 billion. This does not count the car tax payments from the state, which only offset taxes that towns would have collected from their residents. If you’re keeping score, that’s growth of about 1.9% per year — after correcting for inflation. This is troubling, but it’s not necessarily evidence of mismanagement. Inflation measures the price of goods and a few services, while towns spend their money on services and a few goods.

So how best to measure this if not against the inflation rate?  If you want a yardstick with which to measure a service-oriented enterprise like a town, how about a private-sector service like Federal Express? Fedex is fiercely competitive, I hear, and non-union, to boot. How did they do?  In 1990, it cost $11 to send an overnight letter across the country, and today it’s about $25.50 for the same service. After correcting for inflation, that’s up about 2% a year.

What about the state?  After accounting for inflation in the same way, the state’s general revenue has gone up 2.4% per year since 1990, and overall expenses are up even more. (That’s the structural deficit and the rise in state debt you’re smelling.)

So who is being more responsible with tax dollars?  The General Assembly, with members like Baldelli-Hunt who give lectures to municipalities, or the towns, who have controlled costs not only better than the state, but better than Fedex. But it’s the towns who get cut while the state basks in the adulation of business leaders who praise legislators for their tax cuts.

The main message of this budget bill is continuity. This is a budget motivated by policy choices virtually identical to the ones of the previous year, the year before that, the year before that, and so on. The idea is to squeak through another year with minimal pain to everyone, especially the wealthy. But it was to a large extent that very set of policies that brought us to the status quo: high unemployment, bankrupt cities, ever-rising tuitions at the state colleges, and lower taxes on rich people.

Do you like the way things are going around here?  Hope you do, because the legislature is voting this week to give you more of the same.

Who Pays for Tax Cuts to the Rich? The Poor


Deprecated: Function get_magic_quotes_gpc() is deprecated in /hermes/bosnacweb08/bosnacweb08bf/b1577/ipg.rifuturecom/RIFutureNew/wp-includes/formatting.php on line 4387

Deprecated: Function get_magic_quotes_gpc() is deprecated in /hermes/bosnacweb08/bosnacweb08bf/b1577/ipg.rifuturecom/RIFutureNew/wp-includes/formatting.php on line 4387

A correspondent tells me that last week there was a meeting over at University Heights where some residents got bad news about their rent. University Heights was built in the 1960s as a mixed development, split about half and half between market rate apartments and subsidized apartments, available to poor people and families. It’s had quite a history since then, including a period in the early 1990s when it was owned by the tenants’ association.

The recession of the early 1990s brought that dream to an end, and Rhode Island Housing became the owner. In 2006, they sold the project to Fairfield Residential, securing a promise that the affordable units (175 of them) would remain below market rent for forty years.

Now there are a couple of things you have to understand about the practice of affordable housing. One is that almost all the housing out there built under the title “affordable” has a term, at the expiration of which it converts to “market rate” housing. The term might be for 20 years, 40 years, or whatever, but after that, the landlord can rent it for whatever they can get. Sometimes the affordability is extracted from the landlord with a promise of rent subsidies. Other times it’s made in exchange for lower acquisition cost, low-rate financing, or some other way to save money on the project. For an older project like University Heights, most of these ways are not possible, since the project was built long ago. This leaves rent subsidies as the only practical option.

Last week, though, RI Housing announced to some distressed tenants that the apartments they live in have to be transferred to another, less generous subsidy program. Essentially the agency cannot afford to keep the subsidies at the level they had been, so in 2014, the rents for 48 of the apartments will rise substantially.

Why can’t RI Housing afford to keep the more generous subsidy?  Well, in the winter of 2008, as Governor Carcieri looked to the end of the year, there was a looming shortfall. Not only was it the second year of the “flat” tax cutting into revenues, but the coming recession’s bite was already being felt in sales tax collections, too. Rather than admit that the state couldn’t afford the tax cuts under the current conditions, the Governor looked around and noticed $26 million on the balance sheet of RI Housing. So he scooped it out of the housing agency and into the general fund, in order to balance the state’s budget that year.

Why was there a deficit in the winter of 2008?  Partly because of the recession, but also because some of the tax cuts for rich people turned out to be too big. The historic tax credit was too popular, and the renovation of the Masonic Temple hotel used them heavily. The tax credit program was ended that year, because so many credits were outstanding. The data can’t tell us exactly how much these cuts cost, but the income tax receipts that year came in $23 million less than predicted. Personal income in the state didn’t begin to fall until months later, so it’s hard to attribute the loss of income tax collections to the faltering economy.

The $26 million lifted from RI Housing was to fill a small part of a budget hole due in no small part to income tax cuts for rich people. But it wasn’t lying in RI Housing’s accounts unused. It was money intended for the purchase of housing, for subsidizing rents, and for the construction of new units. In other words, it was intended for the benefit of poor people, but Governor Carcieri — and the willing General Assembly leadership — redirected it for the benefit of rich ones. Can there be a clearer example of our state’s priorities over the past decades?

Budgeting for Disaster: Taxing History


Deprecated: Function get_magic_quotes_gpc() is deprecated in /hermes/bosnacweb08/bosnacweb08bf/b1577/ipg.rifuturecom/RIFutureNew/wp-includes/formatting.php on line 4387

Deprecated: Function get_magic_quotes_gpc() is deprecated in /hermes/bosnacweb08/bosnacweb08bf/b1577/ipg.rifuturecom/RIFutureNew/wp-includes/formatting.php on line 4387

Is it really too soon to modify our tax code?

In the discussions of taxes at the State House, one line you hear a lot this year is that our state’s new income tax code is new and we should give it time to see how it works out.  That’s what House Speaker Gordon Fox has said, and I’m hearing that it’s the line of the day on Smith Hill, available from any of the House or Senate leadership.

This is, of course, a silly point to make.  The tax changes made last year basically just baked in the low taxes on rich people offered by the “flat tax” alternative.  It used to be that a rich person could choose whether to pay tax under the tax code everyone else uses or using the flat tax limit, and now the flat tax limit is part of the code everyone else uses.  This part may be new, but the overall “strategy” at issue — lower taxes on rich people, expect economy to get better — has been the order of the day in Rhode Island for a long time.  To illustrate what’s really been going on in Rhode Island tax policy, I put together the following graph.

The blue line is the effective RI income tax rate on a fairly typical taxpayer in the top 1% over the last 16 years, with the various cuts that taxpayer has received indicated.  These cuts don’t count tax credits like the film production or historic structures credits, which are typically only available to high-income individuals and which make the effective rate even lower.  The black line indicates the effective tax rate on the median taxpayer (the 50th percentile).  You can see a slight decline in the 1997-2002 period, but the other changes didn’t do much of anything for them.

The unemployment rate, of course, has nothing to do with the tax rate, except as a rhetorical club used to beat people about the head and neck.  There is no evidence that it has any causal relationship with the state tax rate (in either direction), but the relationship between taxes and “job creators” is commonly invoked to persuade lawmakers to support lower taxes.   I’ve included the unemployment rate on the graph as a service, so you can see how little is has to do with the movement of taxes.

One more thing you should know about this graph.  There is some evidence available that the 2012 tax changes raised taxes substantially on the middle percentiles of taxpayers.  Unfortunately, it’s premature to say more than that, since the data won’t be available until later this year, at the earliest.

The House Finance Committee is holding a hearing on several bills designed to raise taxes on the top 1% Tuesday afternoon at 4:30pm in State House room 35.  Rep. Maria Cimini (D-Providence) is the prime sponsor (with 36 co-sponsors) of a bill to raise the taxes on people earning more than $250,000 per year by four percentage points, with that top rate coming down as the unemployment rate also goes down.  Think of it as a “pay for performance” clause for rich people.  There are also bills by Rep. Larry Valencia (D-Charlestown, Exeter, Richmond) and Scott Guthrie (D-Coventry) that will have more or less the same effect, though the income limits and tax changes are slightly different (neither of those bills have the unemployment clause).

Budgeting for Disaster: How RI Pays for URI


Deprecated: Function get_magic_quotes_gpc() is deprecated in /hermes/bosnacweb08/bosnacweb08bf/b1577/ipg.rifuturecom/RIFutureNew/wp-includes/formatting.php on line 4387

Deprecated: Function get_magic_quotes_gpc() is deprecated in /hermes/bosnacweb08/bosnacweb08bf/b1577/ipg.rifuturecom/RIFutureNew/wp-includes/formatting.php on line 4387

Should URI Faculty get a 3 percent raise? Let me tell you a story and you decide.

URI is the big kahuna among the three institutions run by the Board of Governors. It educates about 16,000 students, around 10,000 of whom are from Rhode Island. Researchers there pull in about $80 million each year in research funding, largely from federal sources, like the National Science Foundation and the National Institutes of Health, but also from corporate sources.

There are some important financial issues going on at URI, and none of them are about raises for faculty. One is that state dollars continue to decline in importance to URI’s budget. Twenty years ago, state general revenue funding of $57 million provided about a quarter of the overall budget of $214 million. Today, we provide $75 million for a budget of $705 million, or just a tiny bit more than 10% [B3-46], making URI essentially a private university with a small public subsidy. State contributions over that time grew at an average rate of 1.3 percent per year while the overall budget grew more than four times as fast.

The Governor is proposing to raise the state’s contribution by a little more than $3 million, which is $2 million more than level funding, so that will hike the percentage of the budget contributed by the state a smidge.

But wait, shouldn’t we be concerned about growth of more than 6 percent a year? Why yes, we should. This is a national problem; universities across the country are seeing this kind of cost inflation. Tuitions are pretty much the only thing around that rivals health care costs in the inflation department.

So what is URI spending its money on? Answer: Not professors. To teach more or less the same number of students, URI has almost a hundred fewer professors than it did in 1994. (I’ve used the 1994 personnel budget in this, because they changed the presentation that year and it matches the 2013 presentation better.) In 1994, the “Education and General” part of the budget had 623 professors of the three ranks (full, assistant, and associate), and in 2013, we expect to have 540. The collection of all full professors have seen their pay climb about 2.8% per year over that time.

Looking at the administration shows a different picture. The top couple dozen administrators—the deans, provosts, and vice presidents—have seen their pay go up an average of 4.5 percent per year. There aren’t more people at the top level of administration, but in 1994, there were 65 people with the title of “Director” of something (or assistant director), and in 2013, there are 89. Individually, their salaries didn’t grow quite as fast as all the deans’ and vice-presidents, but because there are so many more of them, they also saw approximately a 4.5 percent average growth rate.

That kind of growth is high, but doesn’t make it to 6%. How about capital projects? In 1994, URI spent $6.4 million on construction and debt service. This year we’re looking at $68 million, and next year it will come down to $59 million. This is a growth rate of 13 percent a year! If you walk around one of the URI campuses, you’ll see lots of new buildings. But few of them are very crowded.

The other huge growth is in the account that provides student aid to cover rising tuition costs. Tuition this year is expected to go up 9.5% as it has for a number of years in the past. Consequently, the aid bill also rises very fast.

So that’s the story: declining aid from the state, declining numbers of professors, increases in administrator pay and numbers, construction of fancy new buildings, and huge increases in tuition. The construction part makes it seem like investment, but all together, does that really sound like an investment in education to you?

There’s another dimension here. By 1995, URI had already lost a tremendous proportion of its state aid budget. In 1989, state dollars covered 58 percent of the budget, but by 1994 it was down to a quarter. This was a crisis. The University (under its new President Robert Carothers) responded by doing a revenue analysis of all the departments, to see which ones made money, and they abandoned most of the programs that didn’t. They stopped admitting students in 47 degree-granting programs, including 16 in science and engineering. From a financial perspective, this seemed to make sense, though it was virtually unprecedented in American university administration.

From an academic perspective, the benefit was hardly as clear. Consider philosophy. URI still teaches some introductory level philosophy courses, so they still need some faculty. So if you love philosophy enough to pursue a doctorate in it, what URI has to offer you is a career of teaching classes to students who don’t really care about it. This immediately makes URI a second choice for anyone in that field. Maybe you don’t care about philosophy, but there were 46 other programs that got the same treatment.  Is that the best way to get good faculty?  How about not giving them money?

Now I learn from a 2010 “Research and Economic Development” presentation to the URI Strategic Budget and Planning Council that over the ten years from 1996 to 2006, URI saw its research funding grow by 29 percent. Over that same time, UNH saw its research funding up by 271 percent, UVM’s went up 162 percent, and UConn saw its funding rise 136 percent. (All larger than the national average of 117 percent.) This was immediately following that downsizing. Do you think maybe this could have been related to a shrunken faculty? Downsized programs?

The presentation was clearly meant to show how worried the University should be about this poor showing. After all, after educating students, research is most of the point of an institution like URI. Research brings in grant funding, research builds prestige, and research is where the real economic benefit of universities comes from.

But not to worry. The folks who put together this presentation had a plan, which was, I gather, put into action. Their plan: Create a new Vice President.

Read previous posts from this series

Budgeting for Disaster: Cutting the Buddha


Deprecated: Function get_magic_quotes_gpc() is deprecated in /hermes/bosnacweb08/bosnacweb08bf/b1577/ipg.rifuturecom/RIFutureNew/wp-includes/formatting.php on line 4387

Deprecated: Function get_magic_quotes_gpc() is deprecated in /hermes/bosnacweb08/bosnacweb08bf/b1577/ipg.rifuturecom/RIFutureNew/wp-includes/formatting.php on line 4387
FY2013 budget

FY2013 budgetOur budget tour continues with a visit to the Behavioral Healthcare, Developmental Disabilities and Hospitals. The acronym is BHDDH and I’m told by insiders it’s pronounced “buddha.”

BHDDH is spending more time than usual in the news. This is largely because last year they cut $26 million from the budget that would have gone to private providers of care for disabled adults. You can see the cut on page 153 of Volume II of the budget (or page 17 of this excerpt), second line, where $206 million in 2011 went down to $180 million in 2012.

This is a cut about three times as big as Governor Chafee proposed. But if you remember, the General Assembly rejected Chafee’s sales tax changes, so they had to cut much deeper than he’d suggested.

Some background: Rhode Island provides services to these people in two ways. About 220 get services through Rhode Island Community Living and Supports (RICLAS), a state program, and a bit more than 3,000 others get services through private agencies who bill the state for their service. These agencies are almost wholly dependent on those bills.

BHDDH recently commissioned a big study of the matter and determined that the state actually doesn’t pay very much for this service. Over the last few years, the population under care grew slower than any northeast state besides Massachusetts, and we reduced the per capita expense from $76,803 in 2009 to $63,013 in 2011. This is despite being one of only nine states (out of 44 where data was available) without a waiting list for services. In other words, we appear to be getting pretty good service for our money.

There is another side, though. We get this great value by paying people very little. The going rate for direct support staff at the private facilities appears to be between $9 and $11 per hour, even for the unionized folks. Remember, these are the people who are bathing, feeding, teaching, and otherwise caring for highly disabled individuals. By contrast, direct care staff at RICLAS are paid about twice as much. (Representative Scott Slater has sponsored a bill in to set a minimum wage for direct support staff at these residences.)

Conversely—and somewhat unfortunately—some of the executives at the private organizations are paid far more than their counterparts in the state. David Jordan, the CEO of Seven Hills, who runs homes in Massachusetts, too, was paid $533,214 in 2009. ($265k in salary and the rest in pension contributions.) This year he has responded to the budget cuts by cutting support staff pay by 5% and ending most of their benefits. Executive pay was cut 3%, according to UNAP, the union representing workers there.

So what happens when the administration makes a plan to cut costs and the Assembly says that’s great, but please cut three times as much? Answer: some pretty dumb things.

For example, the state will only pay a fee for service provided, as opposed to a per-person “capitation” rate. This sounds fair, but if an employee shows up an hour late to work, the agency gets docked not only that employee’s pay, but also the overhead costs allocated to that hour of pay. It’s not as if the agency wasn’t responsible for that care, or the heat and electricity didn’t have to be paid for that hour.

The state also changed the way they assess the level of disability for each resident. This affects the amount the state pays for their care. We had been using a four-step measure, but it was changed to a seven-step “Supports Intensity Scale” (SIS). The SIS is probably a better measure, but the four-step scale doesn’t exactly translate over to the seven-step one and the staff to do re-assessments simply doesn’t exist. Result: BHDDH simply decided which levels of the old scale corresponded to which levels of the new scale, and voila, they had to pay less to support the residents.

Actually, what BHDDH says is this:

If SIS has not been performed and client is receiving services then, the resource allocation is based on previously approved level of service cross walked to the new levels effective 7/1/11.


So what do we learn from this? That there isn’t much deference to department plans in the Assembly, for better and worse. If you’re a department director with a plan to cut costs, you should probably only present a fraction of those costs, or risk having your department turned upside down by a demand to cut much more. The promise of cuts is like blood in the water; the sharks don’t care where they bite, and presto you have people mobilizing marches against you. Under these conditions, which director is going to volunteer cuts again?

And we also learn about the downside of privatization. Through aggressive use of private group homes and community-based care, Rhode Island has kept costs low, much lower than most northeast states. But part of the reason we could do that is that the private operators of those homes didn’t have to pay their employees well (and could pay their executives too well). Though I’m sure it would help (at some of the agencies), slashing executive pay won’t make up for the cuts; there simply aren’t enough executives with egregious salaries to make up $26 million.

Overall, administrative costs at the private agencies (about 10%) seem comparable to the RICLAS costs, as far as one can tell from the personnel lists in the budget. More important, because these are private agencies, we have only limited control over them. As some will recall, that was part of the point of the whole privatization push. We were to give up control of services so the invisible hand of the private market could work its magic. Well it has, and here’s the result.

None of this is to say it isn’t possible to squeeze costs down over time, but how much less do we want care-givers to be paid? Though we would like to be able to slowly reduce administrative overhead, the sudden cuts of this past year will not have that effect. More likely they’ll bankrupt one or two of the providers, and that will be a lesson to…someone.

Full disclosure: I have recently done some software consulting work for West Bay Residential Services, one of the DD residential care providers, and may do so again someday.

Update: Clarified the makeup of David Jordan’s 2009 compensation.

Read previous posts from this series

Budgeting for Disaster: Medicaid in the Budget


Deprecated: Function get_magic_quotes_gpc() is deprecated in /hermes/bosnacweb08/bosnacweb08bf/b1577/ipg.rifuturecom/RIFutureNew/wp-includes/formatting.php on line 4387

Deprecated: Function get_magic_quotes_gpc() is deprecated in /hermes/bosnacweb08/bosnacweb08bf/b1577/ipg.rifuturecom/RIFutureNew/wp-includes/formatting.php on line 4387
FY2013 budget

FY2013 budgetIn volume II of the budget, you’ll find there the Executive Office of Health and Human Services (EOHHS), which contains the Departments of Children Youth and Families (DCYF), Health (DoH), Human Services (DHS), and Behavioral Healthcare, Developmental Disabilities, and Hospitals (BHDDH).

Collectively these departments spend over $3 billion, about 40% of the overall budget. In the Governor’s budget, only about 40% of that is actual tax dollars, and the rest is either federal money or restricted receipts, such as fees for service.

The big kahuna in the Human Services budget is, of course, Medicaid, so we may as well begin there. The expense for Medicaid has been moved from the DHS budget to the umbrella EOHHS. This, of course, means nothing to the budget’s bottom line, only that the accounting for that expense appears on page B2-118 for years before FY12 and before, and on B2-12 for FY13 and beyond.

So much for where to find it. How much is it? The Medicaid budget for next year is projected to be $1.66 billion, approximately the same as was originally budgeted for this year.

The same as this year? But what about the skyrocketing medical inflation? It’s there, but masked by offsetting cuts in service. The “Managed Care” portion of Medicaid that you see in the breakdown of the Medicaid costs is also known as RIte Care, and it has more than doubled in ten years, though it still amounts to only about a third of all the Medicaid. The annual cost increase for Managed Care has been about 7.5% each year. Eligibility rules tightened, but demand increased, so that includes a very minor decrease in enrollment over that time. What’s worse, federal reimbursement paid for 55 cents of every dollar in 2003, almost 64 cents in 2010 (part of the stimulus package) and only 51 cents in 2013.

In order to control these costs, the state has added or increased co-pays and restricted eligibility several times in recent years. Apart from that, there has been little more than some studies and planning from Lt. Governor Elizabeth Roberts in response to this ongoing disaster—remember, this affects everybody, not just the state budget—and this year is no different. The Governor’s 2013 budget will cut all dental care for adults to save $2.7 million. “Refinements to Medicaid managed care programs” will save another $2.5 million [ES-56]. Lots of these refinements involve cutting services, though some, like providing more care through “Patient-Centered Medical Homes” are potentially good ideas, depending on how they’re implemented.

One problem with the push for managed care is that in some cases it may well insert a new layer of bureaucracy where none is needed. A director of a residential care provider pointed out to me that his agency is already providing managed care for most of their residents. That is, with the advice of a consistent array of medical professionals, the agency selects care options for its residents. This is pretty much what the medical home concept suggests. If new requirements simply force them to add a layer of doctors to what they’re already doing, it won’t necessarily reduce any costs or improve any care. (It also calls into question the cost savings estimates for the managed care push.)

The other big component of cost saving in Medicaid is a proposal to save another $14 million by simply paying 4% less for the care.

Paying less? Who knew you could just solve the health care cost problem so easily. Why didn’t we think of this years ago? But yes, the Governor’s budget proposes paying 4.14% less for all Medicaid coverage that require a monthly per-person fee (“capitation”). This is mostly Neighborhood Health Plan, though  United Health also has a share of that market. Neighborhood, though, has the misfortune of being in the business of serving the Medicaid population almost exclusively, so they will be much harder hit than the other two. Obviously any cost cutting reform has to start somewhere, but it’s hard to see how this will do the trick.

It’s worth an aside here to mention one of the factors in health care cost inflation that seems never to come up in serious discussions of the rising cost of health care. After all, what’s the fastest-growing component of a medical practice’s expenses? More likely than not, it’s health insurance for its employees. For all the fancy machinery of modern medicine, it’s still a labor-intensive business. A giant facility like Rhode Island Hospital puts more than half its budget towards salaries, and a small practice will see an even higher fraction, 70% or more.

A physician’s assistant earning $65,000 a year is probably receiving a health benefit worth around 20% of that if he or she has a family. What’s more, all those pharmaceutical firms, medical device manufacturers, and bandage makers also have to deal with rising health care costs. In other words, a significant part of what an increase in health care costs pays for is… an increase in health care costs.

This sounds like a dopey little irony, but engineers call this a feedback loop, and electronic systems with less feedback than this also spiral out of control. Obviously there are plenty of factors driving health care inflation—not least the vast number of people who see health care as a way to get rich—but at root, linking health care and employment creates an unstable system, prone to amplify increases.  Could that not be worth some attention?

Next: Food inspection dereliction
Read more from this series

Budgeting for Disaster Part VII: Quasi-appropriate?


Deprecated: Function get_magic_quotes_gpc() is deprecated in /hermes/bosnacweb08/bosnacweb08bf/b1577/ipg.rifuturecom/RIFutureNew/wp-includes/formatting.php on line 4387

Deprecated: Function get_magic_quotes_gpc() is deprecated in /hermes/bosnacweb08/bosnacweb08bf/b1577/ipg.rifuturecom/RIFutureNew/wp-includes/formatting.php on line 4387
FY2013 budget

FY2013 budgetTrick question: Why is Rhode Island’s housing policy not made by the state government? How about economic policy? Why do we have two environmental agencies? Two elections agencies?

The questions sound unrelated, but they have very similar answers, and they’re all related to the state’s bevy of “quasi-public” agencies—whose budgets are in Volume I of the budget.

The Airport Corporation is here, who runs all the state’s airports, including Green. The Economic Development Corporation is also here, along with Rhode Island Housing, RIPTA, the Narragansett Bay Commission (sewers in Providence and Pawtucket), the Resource Recovery Corporation (runs the central landfill), and several others.

Truthfully, it’s more correct to say the outlines of their budgets are in Volume I [B1-331-366]. There isn’t much information there about some very important agencies, and in some cases this was part of the point of keeping them separate from the regular parts of the state government.

Some of the quasi-publics were formed when the state took over existing private corporations. RIPTA, for example, was formed to save the last private bus company. Others have a separate existence for legal reasons. The Turnpike and Bridge Authority, which maintains the Pell and Mt Hope Bridge, was formed to issue bonds against the toll revenue collected at those bridges. But many quasi-publics—along with some other agencies less quasi and more public—were formed out of power struggles between the legislature and the governor.

The Coastal Resources Management Council, for example, our extra environmental agency, was originally formed in the 1970s so that powerful members of the legislature could circumvent new DEM coastal regulations on behalf of their friends who owned waterfront property. Rhode Island Housing (technically the RI Housing and Mortgage Finance Corp.) may have originally formed to access some federal HUD funding, but it was also a creature of the legislature, witness the mortgage scandals of the 1980s. Later, under a stronger Governor, the Economic Development Corporation was created out of the Department of Economic Development to give the Governor Lincoln Almond more control over economic policy (and to pay its executives more like the corporate executives they lunch with).

EDC has another distinction. When it was spun out of the government into a quasi-public, it took over the shell of the RI Port Authority. Why? Because after Bruce Sundlun effectively put the Public Building Authority out of business (it was a campaign promise), the Port Authority was the only agency with unlimited authority to borrow money without voter approval. And boy have they used that authority. EDC now owes debt used for the Fidelity campus in Smithfield, the Shepard’s building in Providence, the Masonic Temple hotel across from the state house, the I-Way boondoggle, the Sakonnet River Bridge, and much more. Subsidiaries owe the debt used to build the airport and renovate Quonset.

Under Ed DiPrete, the PBA’s record of borrowing without voter approval was considered a minor scandal and contributed to his election loss in 1990. But none of these subsequent projects got voter approval. Don Carcieri managed to double the state’s debt, and almost all of it was unapproved borrowing, so it’s difficult to remember why it was such a problem for DiPrete.

There will be more to say about this borrowing when we look at the Capital Budget document. For now, let’s look at one of the quasi-publics that spends a lot of time in the news lately over its budget.

RIPTA

The state’s public transit authority was formed when the private bus company that ran transit in Providence and vicinity went under in the 1960s. It wouldn’t be correct to say it has had an untroubled existence until recently, but it did not always have the persistent deficit it has now.

What’s happened to the agency in recent years is a few things. First, like the rest of the state, it is a victim of our crazy health care system. Ten years ago, employee benefits were $10.5 million for a $28.7 million payroll. (For union employees, pension payments are a fraction of the health care costs, though their growth has tracked the health care costs fairly well.) In 2013, we’re looking at $24.8 million in benefits for a $45.8 million payroll [B1-355]. The cost of health care is going up almost two and a half times faster than payroll costs.

Second, transit for disabled people has taken a tremendous number of resources. Paratransit services between 2001 and 2011 more than quintupled, from a cost of $1.8 million to $9.1 million, and there are other categories of service that provide more or less the same function.

Finally, the gas tax has been a problem of its own. A portion of the gas tax is dedicated to RIPTA. The problem is that the gas tax is constituted as a number of pennies per gallon of gas. When gas prices rise, the gas tax actually falls, as people buy less gas. But when gas prices rise, RIPTA’s cost for fuel also rises. In other words, as gas prices rise, RIPTA’s ridership rises, and so do its costs, at exactly the same time that its gas tax revenue falls. Why does it seem that RIPTA is permanently in trouble? Because its funding system makes no sense, and provides falling revenue when expenses rise.

And for those who wonder what is the value of RIPTA to Rhode Island, take it from me that it’s actually pretty hard to get a seat on several of the lines I use frequently. High gas prices mean lots of riders, and also mean service cutbacks.

Unfortunately, pretty much none of the people who make funding decisions about RIPTA—its board, legislators, the Governor or his staff—actually use the system, so it turns out that RIPTA’s funding problems are thoroughly unaddressed in Governor Chafee’s budget. The documents cheerfully predict a $10 million operating deficit by June 2013 so we’ll be seeing lots of RIPTA headlines in the coming year.

Budgeting for Disaster VI: DMV Manages for Success


Deprecated: Function get_magic_quotes_gpc() is deprecated in /hermes/bosnacweb08/bosnacweb08bf/b1577/ipg.rifuturecom/RIFutureNew/wp-includes/formatting.php on line 4387

Deprecated: Function get_magic_quotes_gpc() is deprecated in /hermes/bosnacweb08/bosnacweb08bf/b1577/ipg.rifuturecom/RIFutureNew/wp-includes/formatting.php on line 4387
FY2013 budget

FY2013 budget

One part of the Department of Administration that gets a lot of press is the Department of Motor Vehicles, which is actually a unit of the Department of Revenue. DMV, of course, gets press because people don’t like it, and the lines are long, and it’s in an inconvenient place, and so on and on.

Over last spring and summer, the agency saw a turnaround. Spurred on by stories of multiple-hour wait times, Governor Chafee appointed a new director, who made some management changes, shuffled people around, re-engineered the lines, put “greeters” out front to explain things, closed some satellite branches, and generally shook things up. Lo and behold, the wait times plummeted. An inspiring tale of how good management can make all the difference? A story of re-inventing government to do more with less in the 21st century? Well sort of, but not quite.

Watching the ticking clock in line at DMV has been a part of life for all of us in Rhode Island for a long time, but it’s not right to say that it’s been a neglected problem. Lincoln Almond suggested adding $300,000 per year to expand their hours, and Don Carcieri made a point of “fixing” it, too. He even listed new efficiencies and reduced wait times as one of his accomplishments in a 2004 interview.

But time went on and service decayed until it took hours just for routine business to happen. I waited there with my daughter for three excruciating hours one fine day in 2010, along with about three hundred good friends. By the time Lincoln Chafee took office, DMV was a joke, a travesty of government service. Chafee brought in a new interim director, Lisa Holley, to troubleshoot the agency, and — what do you know? — she got results. Wait times shrank dramatically and while it’s still hard to describe a visit to the DMV as a pleasure, the last time I was in one, last August, I was in and out in 25 minutes.

So what happened? What management magic did Holley bring to the agency? What lessons can we learn? Mostly just that it takes people to do the work.

In the dark days of 2004, when Don Carcieri was taking credit for improving wait times, he was adding employees, and adding satellite locations. You can see the progress in the graph to the right, which counts customer service representatives in the department. Service got better with the new workers, and a little worse with the satellite offices. But then around 2006, Carcieri decided it was ok to let the service decay a little bit. He said the state had too many employees, and he started to enforce the statewide hiring freeze on DMV. And then the retirement fiasco of 2009 came, and a bunch of people left, and so in 2010 you had all the satellite locations, and 22% fewer people to stand behind all those desks.

And that’s the crazy thing about management by attrition: you don’t get to plan for the loss of people. Carcieri simply said we’re not hiring any new people and we’re going to encourage people to retire, and that’s that. The only surprise was that people were surprised that service suffered — a lot.

So again, what management magic did Holley bring? She insisted on having more people, that’s what. Chafee asked the Assembly for 25 new workers. They balked, but they did cough up some, and so now there are almost as many people on the customer-facing staff as there were in 2006, at half as many locations. Of course there were some other improvements: line management systems, those greeters, a redivision of labor. But sometimes the big story is the simpler one: we got better service with more people.

There is another story I see lurking here. Governor Chafee saw a problem of poor service and acted to fix it, while Governor Carcieri saw the problem in terms of taxes, and acted to fix that instead, mostly by giving tax cuts to rich people. How did that work out for you?

There is one other feature to the DMV budget that should not go unremarked while we’re here. The RIMS computer system that was supposed to create a whole new class of efficiencies by getting all of DMV’s information about you in a single database is quite a bit behind schedule and over budget. This is pretty much SOP in the database development world, public and private. That is, it’s a shame and a waste of state dollars, but it’s not exactly unprecedented. I bring it up at least in part because you can’t exactly see it in the budget presentation, but you can see it in the Capital Budget, which we’ll get to soon.

NEXT: The Quasi-Publics
Read the previous posts in this series

Budgeting for Disaster Part V: Granting a Problem


Deprecated: Function get_magic_quotes_gpc() is deprecated in /hermes/bosnacweb08/bosnacweb08bf/b1577/ipg.rifuturecom/RIFutureNew/wp-includes/formatting.php on line 4387

Deprecated: Function get_magic_quotes_gpc() is deprecated in /hermes/bosnacweb08/bosnacweb08bf/b1577/ipg.rifuturecom/RIFutureNew/wp-includes/formatting.php on line 4387
FY2013 budget

FY2013 budgetOur tour of the state budget documents continues. We leave the Executive Summary for the time being (we’ll be back for the all-important schedules and for the invaluable predictions of the future), and move into Volume I.

Volume I covers “General Government”, which includes the offices of all the elected officials, and the departments of Revenue, Business Regulation, and Labor and Training. Plus the Department of Administration which holds all the central functions. It’s also got all the quasi-public agencies like the Economic Development Corporation, RIPTA, the Airport Corporation, and Resource Recovery, who runs the state Central Landfill. For each department and agency, there is a summary page, and then a page for each of the major divisions. This is the part of the tour where the guide is supposed to tell funny jokes to fill up the travel time as you cruise from one interesting locale to the next.

The legislature’s budget is in this volume, so let’s look there first. The overall budget for the Assembly is about $41 million this year, and the Governor is proposing to cut it by a little more than $1 million, about half from supplies and expenses and the rest from the grants budget. There’s no change in the number of personnel, and it looks like they’re anticipating a 3% raise for most everyone, and — what’s this? — it’s the rising cost of health care, just like everywhere else. Remember, no matter what you’ve been told, it’s rising health care costs that are pushing up the cost of your government more than anything else.

Legislative grants

Oh, wait, did you want to hear about the infamous grants budget? This is the source of the legislative grants, random bits of money awarded by the leadership to reward this or that legislator for helping out around the place. It mostly goes to non-profits in the legislator’s home district, like say, Dan Doyle’s Institute for International Sport that we’re hearing so much about these days. They apparently got $575,000 in 2007 for a fabulous building on the URI campus that remains unfinished today.

There are also plenty of excellent, well-run non-profits who get support this way. The problem is that the way these grants are awarded has a lot to do with ring-kissing and begging and maybe not so much to do with merit. Lots of ring-kissers have other merits, but when merit isn’t the main criteria, you’ll undoubtedly get some who are better at the kissing than the service. (This makes the occasional screw-up like the Institute into the fault of some specific person, though no one seems to be saying who just yet.)

How much does it cost? On paper, you’ll see a grant budget line item of $2.8 million in the current year, and the Governor is proposing to cut it back to $2.3 million. The way the system works, though, there is much more than that available. The way it works is that lots of the dollars will wind up as line items on the budget of some agency whose mission is vaguely related to the non-profit’s. So a theatre might get a grant and it would come directly from the RISCA budget, not from this line item. This is a problem both because it provides less money for the agency mission, something that you can’t see from the budget documents, and because counting all those grants isn’t possible from the outside.

What else? One can’t help but notice that despite the modest cut Governor Chafee has proposed, the legislature’s budget is up a healthy 42% in ten years, 2003-2012, about 3.5% per year. This is somewhat less than overall state expenses, which are up 48%, but it’s embarrassingly close to the 42% rise over that time in the statewide property tax levy. One thing you’ll hear if you wander around the halls of the State House and talk to legislators is complaints about out-of-control municipal budgets. What those legislators don’t seem to understand is that the town councils and mayors are doing pretty much as good a job as the legislators.

It’s easy to understand legislators not noticing this. What’s less forgivable is the way they keep voting to cut taxes without cutting their own budget. Over that decade 2003-2012, we saw a capital gains tax cut, an income tax cut for rich people, and several high-profile tax credits pass the Assembly. At none of those times did anyone propose a proportional cut in the Assembly’s own budget. Cuts for thee and not for me. If you care about controlling costs in government, this is the kind of behavior that has to be rendered embarrassing (or at least politically dangerous) for elected officials.

Time to move on. Next stop: DMV!
Read the previous posts in this series.

Budgeting for Disaster Part IV: Lack of Education


Deprecated: Function get_magic_quotes_gpc() is deprecated in /hermes/bosnacweb08/bosnacweb08bf/b1577/ipg.rifuturecom/RIFutureNew/wp-includes/formatting.php on line 4387

Deprecated: Function get_magic_quotes_gpc() is deprecated in /hermes/bosnacweb08/bosnacweb08bf/b1577/ipg.rifuturecom/RIFutureNew/wp-includes/formatting.php on line 4387
FY2013 budget

FY2013 budget

After spending time with Appendix C of the Executive Summmary, it only makes sense to dip into Appendix D, doesn’t it? C was about state aid to the parts of municipal budgets that aren’t education. D is about the much bigger contribution the state makes to education.  Once again, the really interesting things about the numbers in D are how they’ve changed over the years.  (The information is reproduced in the Technical Appendix, page 211, and that table goes back more years.)

You can write an entire book or two about the funding of education in Rhode Island. But this is a tour of the entire budget, so we’re just going to skim some of the important points.

In 2013, the Governor’s budget would provide $674 million to all the cities and towns, to help run their schools, plus another $46 million for charter schools. This is up from $616 million last year, and the difference is revenue from the proposed increase in the tax on restaurants and hotels.

As of 2010, the latest year for which the collected municipal budget data is available, all the cities and towns together spent $1.79 billion on education. To that amount, the state contributed $592 million, plus another $30 million for charter schools.

A couple of points leap out here. The first is that, just since 2010, charter schools have seen a 53% increase in state funding, while everyone else got 15%. You might sniff at that and say 15% isn’t nothing, but in 2008, the traditional schools got $98 million more than they got in 2010, and $16 million more than they’ll get in the proposed budget — the rosiest scenario on the table — in 2013. That is, between 2008 and 2010, they were cut from $690 million to $592 million. The Governor’s proposed increase doesn’t even get back to the 2008 level. Not to belabor the point or anything, but during each of those years, rich taxpayers were granted an increase on the “flat tax” cut.

Oh, and the charter schools? They got no cut at all. Some years they might not have received what they were hoping for, but between 2007 and the present, each year they received more than the previous year. Sauce for the goose is apparently too good for the gander.

Splitting the cost

The other important point you learn from this page is that the state picks up around a third of the cost of education for the cities and towns, or a tiny bit more, depending on whether you’re inclined to count the charter schools or not. Back in the misty dawn of time, under the, um, storied administration of Ed DiPrete, the state’s official goal was eventually to fund 60% of local education costs. At the time, they were at approximately 50%, and there was a plan to get to the goal by sometime in the 1990s.

The plan was undone by the credit union crisis and the fiscal crisis it provoked, but its demise was due at least as much to the weakening influence of municipalities in the state house. Ed DiPrete, for all his faults, had been a Mayor, and seemed to understand the fiscal strains felt at City Hall. Bruce Sundlun, to put it mildly, did not. Nor did his successors, until Governor Chafee. Matty Smith, House speaker during the 1980s, was much more solicitous of the cities and towns than any of his successors have been. There was a lot wrong with the state house of 1988, and I wouldn’t want to go back to that era, but we didn’t have cities and towns threatening bankruptcy, either, did we?

What about cost inflation? Should the state guarantee a proportion of the costs for municipalities who have been unwilling or unable to control the costs of education? This is the point at which people commonly invoke the evil teacher unions. Certainly unions have played a big role in keeping teacher salaries up, but lately they’ve also played a big role in offering concessions to keep costs down. The 2009 edition of RIPEC’s school finance report (the latest one on their web site) tells me that teacher salary inflation in Rhode Island lagged the national average over the previous decade. We spend more per pupil than the national average, but we also live in an expensive part of the country.

The fashion in education reform these days is nattering about how to improve the quality of teachers, but the dominant trend seems to be to find ways to do that without money. I’m not sure what happened to, “you get what you pay for,” but it certainly isn’t the way policymakers think about teachers. So now we have “value-added” ratings and teacher testing mandates and all the rest. The research behind these trends is flawed by some strange assumptions about the teaching profession — it’s a perfect example of sophisticated statistics employed in pointless fashion — but leave that alone for a moment. I can think of only one valid way to judge whether teacher salaries are appropriate: do job ads result in a harvest of excellent resumes? If so, the salaries are appropriate. If not, well, not.

According to the same RIPEC report, Rhode Island has the eighth highest-paid teachers in the country. This is tragic, right? But according to a survey I did a few years ago we also have the seventh highest-paid accountants in the country and the fifth highest-paid veterinarians. Architects, pharmacists, counselors, and other professional jobs, are also paid quite well here. It wasn’t unions who drove those salaries up. The evidence seems that school departments are responding to the vicissitudes of the labor market, just as the employers of those accountants and veterinarians are. People who want me to believe it’s all the unions’ fault have to provide a much more detailed analysis to support their claims than I’ve recently seen.

What else?

There are other important factors beside salaries that push up costs, and some of them are in the personnel column. A recurring theme in budget browsing is the cost of health care, and until the state’s pension payments superseded them recently it was pretty much impossible to talk to a superintendent about costs without hearing about the skyrocketing cost of health benefits. You can’t spend any time with a budget without understanding that bringing down the cost of health care must be a national priority.

What else? How about that federal funding of special education mandates cover substantially less than a fifth of those costs? How about all the mandates of “No Child Left Behind”? The National Governor’s Association voted in 2003 to label both of these “unfunded mandates”, and they have only become more onerous since. How about that despite the calls for consolidation of services, school districts have only become more fragmented in the last decade, as more charter schools come online?

It’s a long list and education funding is a complicated subject — we haven’t covered the new funding formula, the suit from cities who say it’s not fair, the way we fund charter schools, the aid for school construction (“housing aid”), and lots more — but it’s a big budget to cover and it’s time for the tour to move on. Just one last word. Yesterday there was a hearing at the House Finance committee about the proposed hotel and meals tax that would make up a part of the local education funding lost since 2008. Lots of people protested it, but I’m not aware of any who proposed cutting this aid to schools. In fact, I’m not aware of any who were at all specific about what should be cut to avoid this increase. Readers who know otherwise are invited to send along copies of the testimony, and I’ll post them here.

Next: Budget Volume I

Budgeting for Disaster – Part III


Deprecated: Function get_magic_quotes_gpc() is deprecated in /hermes/bosnacweb08/bosnacweb08bf/b1577/ipg.rifuturecom/RIFutureNew/wp-includes/formatting.php on line 4387

Deprecated: Function get_magic_quotes_gpc() is deprecated in /hermes/bosnacweb08/bosnacweb08bf/b1577/ipg.rifuturecom/RIFutureNew/wp-includes/formatting.php on line 4387
FY2013 budget

FY2013 budgetWe continue our tour of state budget documents. The Executive Summary  has a lot of useful information, but the parts that I find myself referring to most often are not the text descriptions of the Governor’s program for the various departments, but the numbers in the back: the summary tables, the planning values the Budget Office used to predict the future, the wonderfully informative appendix C, which shows how much state aid each Rhode Island city or town gets, and appendix D, which does the same for education aid.

In a state with one bankrupt city and several more threatening to dive into bankruptcy, these are the focus of a lot of my attention. What deserves at least as much attention are the same sections from previous years. Let’s start with Appendix C.

The first thing you’ll notice if you flip, click, scroll, or slide to Appendix C is that local aid comes in lots of different forms. There is “appropriated aid”, which comes out of the general state taxes (called “general revenue” in the budget), and “shared” (or “pass-through”) aid, which is money the state collects on behalf of a city or town. For example, “payment in lieu of taxes” (PILOT) money is paid to a town instead of taxes on state property, and is appropriated in the budget, while the meals and beverage tax is a portion of the sales tax, collected on behalf of a city or town and passed on to them.

The meals and beverage tax collected in Providence restaurants goes to Providence and the tax collected in Newport restaurants goes to Newport, and so on. The numbers in the appropriated aid represent actual decisions made by legislators and the governor. The shared aid numbers are just estimates of how much those taxes will bring in.

There are a couple of things worth noticing about these numbers. One is that the state is planning to give the cities and towns $61 million in appropriated aid in 2013, which is exactly the same amount budgeted for 2012. Level funding sounds like a cold shower, but compared to recent history, it’s a warm bath. In 2008, appropriated state aid amounted to about $250 million. Or well, it would have, except the legislature cut $10 million halfway through that fiscal year. Providence got a $2.4 million cut, Pawtucket lost $850,000, and Woonsocket lost $600,000. Central Falls was hit for $250,000.

These are cuts in the neighborhood of 1%, which doesn’t seem that big a deal, although they came halfway through the fiscal year, so the cities and towns had to cut around 2% of their expenses to make up for the lost time. For cities under financial stress, this hurt.

For 2009, the Governor proposed a slight increase in aid, back up to $244 million. But once again, this was cut halfway through the fiscal year, to $215 million. Providence was cut $5.7 million, Pawtucket $2 million, Woonsocket $1.4 million, and Central Falls $600,000. Again, the cuts came along well into the fiscal year, making them at least twice as hard to deal with. For Central Falls, this worked out to cutting more than 7% of the annual municipal budget in a few months.

The pretense of maintaining the level of aid was burst by this point, so the Governor proposed cutting municipal aid by 14% for fiscal year 2010, to $184 million. Are you keeping track? To recap: In September 2007, Central Falls was on track to get $3.6 million from the state, or a bit less than a fifth of their budget. By May of 2009, the Governor was suggesting they get by with half that amount, a 10% cut in their budget.

But even that cut wasn’t enough, and with only months to go in the 2010 fiscal year, the state slashed total aid yet again, from $184 million to $118 million. Providence saw a $12 million cut, Pawtucket $5.1 million, Woonsocket $2.8 million, and Central Falls $750,000. This time, quite a bit of the cut came in the last quarter of the year, leaving virtually no time to make up the cuts. And for the 2011 budget Carcieri proposed to cut total municipal aid all the way down to $49 million. That year, insurgents in the Assembly pressured the leadership to put a little aid back in the budget, but it still only got up to $60 million, down 76% from just three years before.

I’m sure it was a coincidence that Central Falls went into receivership in May of 2010. At least the way everyone talks about Central Falls, their bankruptcy was all the fault of their unions and retirees, and the state played no part besides offering them a receiver to work out their issues. Their annual budget was $18.9 million in 2008, of which $3.6 million was state aid. In 2010, they were promised only $1.8 million, but got only $1.1 million. And in 2011 they didn’t even get half of that.

In 2008, Providence expected to get $65 million from the state, to help with its $302 million municipal (non-education) budget. In 2009, it went down to $57 million, and in 2010, the city still expected to see $49 million, but got $29 million instead. Over two short years, the state cut 10% of the Providence budget, and each time it happened well after the fiscal year was underway. But it’s fashionable to blame David Cicilline for Providence’s fiscal crisis, so apparently there’s no point in asking Governor Carcieri or any of the Assembly leadership what made them think the municipal budgets could withstand this kind of abuse without cracking.

Here’s the part that makes it all a bit worse. A lot of the aid cut technically did not go to the city or town itself, but to you. In the fall of 2009, towns expected $133 million of state aid to reduce the property tax on your car in fiscal 2010. The state was paying a portion of your taxes for you. The towns only got half of that, and almost all the rest was cut for fiscal 2011. Essentialy, the state was telling the cities and towns to make up the difference from property taxes on cars—now! Some did send out new car tax bills, but many just sucked it up and made cuts.

You see a lot of people wringing their hands about Rhode Island’s municipal fiscal crisis—How will we pay for all those retirees? What were those Mayors thinking? Can you believe those unions?—but how often do you see the story of the state budget included in the saga?

When I describe this sequence of events to people, they will point out that state revenues plunged in 2009, so the state had no choice. But this is an absurd position to take. After all, during each year of these huge municipal aid cuts, Rhode Island was increasing the amount of a generous tax cut granted to the richest taxpayers in the state. That is, taxes were cut further each year at the same time aid was slashed to all the cities and towns. Governor Carcieri and Assembly leaders felt that lower taxes on rich people were important enough to slash aid to  cities and towns—a position they still hold.

Next: Education (really)

Budgeting for Disaster – Part II


Deprecated: Function get_magic_quotes_gpc() is deprecated in /hermes/bosnacweb08/bosnacweb08bf/b1577/ipg.rifuturecom/RIFutureNew/wp-includes/formatting.php on line 4387

Deprecated: Function get_magic_quotes_gpc() is deprecated in /hermes/bosnacweb08/bosnacweb08bf/b1577/ipg.rifuturecom/RIFutureNew/wp-includes/formatting.php on line 4387
Growth of the state budget over the past 20 years. Looks scary, no?

Growth of the state budget over the past 20 years. Looks scary, no?

Look at it grow

So what’s in the state budget? Funny you should ask. In the accompanying chart, you can see the breakout in a graph prepared by the House Fiscal staff. They publish a digest of the budget every year that is pretty helpful in figuring out what’s going on. What you can also see from the graph is how the budget has grown in 20 years.

What you see looks like huge growth, and if you compare it to the inflation rate over those 20 years, it seems to confirm what everyone says, that government spending is out of control and so on. You know how that song goes.

In fact, there are some serious problems in government spending, but they’re pretty specific and we’ll get to them. But first, let’s talk about inflation. The inflation rate is calculated based on a household’s expenses, and it looks at the rise in prices of the things that people buy: groceries, gasoline, auto insurance, medical services, TVs, washing machines, and so on. Your state government does not actually buy a lot of groceries, and I’m betting that you do not buy a lot of services from corrections officers or park rangers. That is, there’s no reason to think that the inflation rate tells you anything useful about how much government spending should grow.

What’s really at issue in questions like this is whether the taxes the state levies are weighing down the state’s economy. If taxes are soaking up a bigger proportion of the state’s economy than 20 years ago, that’s not good news unless we’re getting a lot more services. So what’s the story?

In 1992, the state collected $1.74 billion in taxes, and the state’s economy (measured by personal income reported by the BEA) was about $21.1 billion. So the state collected taxes equal to 8.25% of the overall economy. Using the 2011 BEA income number and the economic predictions in the budget [on budget page ES-13] we expect personal income in 2013 to be about $49.7 billion, out of which the Governor’s budget will pull $3.27 billion in taxes, or 6.6%, or nearly one-fifth less than in 1992.

Ok, you say, but property taxes have taken up the slack, right? In 1992, RI cities and towns collected $990 million in property taxes, meaning that state and local taxes together were around 12.9% of the state’s economy. I don’t know what property taxes will be in 2013, but they added up to $2.11 billion in 2011. In order for them to get up to the 1992 proportion of the overall economy, property taxes will have to jump by 48% from their 2011 levels. They went up a lot last year, but no city or town’s taxes went up nearly that much.

In other words, no matter how you slice it, state and local taxes are taking up a smaller share of the state’s economy today than 20 years ago. Maybe it’s hard to believe, but it’s true: the biggest reason we’re getting less government these days is because we’re paying less for it relative to the size of the economy. If state and local taxes added up to the same proportion of our economy in 2013 as in 1992, the state and cities and towns would have an additional $900 million dollars in revenue each year, far more than the deficits of the state and all the cities and towns put together. I’m not saying that this is the right measure, but it’s not possible to argue successfully that the gross level of state and local taxes we have now is slowing the state’s economy.

Again, I know this is hard to believe, but in reality there is a specific reason why it’s hard to believe, and there are ways in which our taxes are slowing our economy.  You just can’t see it in the broad averages. We’ll get to that down the road, when we get to a detailed picture of taxes. For now, I’m going to stay on spending, and focus on the makeup of the bars in the graph next.

Assistance, Grants, and Benefits (really)

The legend is a little hard to read, but the yellow at the bottom of each column is personnel expenses (which includes benefits), and moving up, you have good old “Other”, followed by aid to local governments, “Assistance, Grants and Benefits”, capital expenses, debt service, and operating transfers. Let’s look at the big ones here.

Starting again from the bottom you have personnel expenses. This includes the infamous pension payments, which have gone up a lot since 1992, but have been pretty well matched by the rise in health benefit costs. For 2013, the pension payments will be about $167 million, and health benefits $183 million [ES-32]. The 1992 payroll included a bit more than 16,000 state employees (on paper). As of now, there are 13,700 employees, almost 1,000 fewer than are officially in the budget.

What about salaries? This is a little harder. You see, until recently, the budgets were silent about how many positions were actually filled. You’d see that 16,000 employees (full-time equivalents) were approved for the budget, and that’s all it would say. But some positions hadn’t been filled for years, and lots of unfilled positions had no money appropriated for them. If you take a strict apples-to-apples comparison, you get that the average annual wage of a state employee in 1992 was about $37,000, and in 2012, it was $61,300. It turns out that this is pretty much exactly the rate of inflation for those years. On paper, at least, salaries have risen slower than the budget as a whole. It’s not possible from the public documents to say how many positions were filled in 1992 (though maybe a reader will have that number for me). But you can say that wage growth is absolutely not driving the budget’s growth.

Moving up to the purple band, you have the aid to local governments. The bulk of this is education aid, scheduled to be $674 million in 2013 [ES Appendix D]. This is a big number, and quite big enough to mask the devastating cuts to aid to the non-education parts of local government in 2008-2011. In 2008, the state appropriated $244 million for aid to municipal governments. In 2011, that number was $60 million [ES Appendix C]. Education aid was cut during those years, too, but not nearly as much. Are you still wondering why municipal governments are struggling to stay above water? You can sort of see this decrease in the 2008-2011 columns, but the presentation doesn’t make it very clear.

The blue band above the purple is the one that excites the most attention. This is “Assistance, Grants, and Benefits.” It sounds like it means welfare, but it’s just an accounting category, and covers everything from Medicaid to the money the state library gives to the Historical Society to maintain the collection of battle flags in the state house atrium, the silver tea service from the USS Rhode Island, and the other artifacts they keep for us. It also includes student aid at URI, unemployment insurance, TDI payments, and more.

The big bulk of this chunk is Medicaid, at $1.66 billion [B2-12 and B2-118 for previous years]. It is probably the fastest growing chunk of this category, too, but it’s not easy to be sure from the documents. Less than half of it is actually health care to poor people. Most of the rest is care for the disabled and elderly. The state pays approximately 48% of the cost, and federal dollars cover the other 52%.

Here’s the point I can’t help see in this graph: The biggest cost driver in the three biggest parts of the budget is health care. It’s more than 10% of personnel costs, it’s part of what cities and towns use state aid to pay for, and it’s far and away the biggest part of the Grants and Benefits layer. If you really want to find the reasons why the state is spending as much as it is and seems like it’s getting less than in 1992, the cost of health care is impossible to ignore.

And yes, you could solve the budget problem by cutting health care out of the budget—slash employee benefits, and all benefits to poor people, wheel the old people and disabled out of their group homes and down to the curb. That might keep health care costs from bankrupting the state, but it won’t keep it from bankrupting all the rest of us. If there ever was a case for government malpractice, it can be found in the utter silence of Lincoln Almond and Don Carcieri when it came to addressing this problem.

Next: Municipal Budgets
Full Series: Budgeting for Disaster

Budgeting for Disaster – Part I


Deprecated: Function get_magic_quotes_gpc() is deprecated in /hermes/bosnacweb08/bosnacweb08bf/b1577/ipg.rifuturecom/RIFutureNew/wp-includes/formatting.php on line 4387

Deprecated: Function get_magic_quotes_gpc() is deprecated in /hermes/bosnacweb08/bosnacweb08bf/b1577/ipg.rifuturecom/RIFutureNew/wp-includes/formatting.php on line 4387
FY2013 budget

FY2013 budgetOne of the problems of political journalism is trying to parse the difference between what’s really going on and what is said about it. Press releases are misleading as often as they are informative, and interviews seldom get at any matters beyond the superficial.

That’s the secret pleasure behind budget analysis. A budget document is the policy choices of the government made manifest. You don’t have to ask someone what the policy is, it’s there in the sums. There are, of course, ways to obscure policy within a budget, and not all budgets are presented well, but these problems pale before trying to decipher what some people mean when they talk about policy issues. What does it mean to “cut” a program? What does “level funding” mean? Is some program really “new?”

The problem with open government is that sometimes there is altogether too much information available. You can go to the RI Open Government site now and learn how much any department spent on postage last month. That’s fine, but once you know that, what do you really know? The state budget is something similar. The budget documents for the state of Rhode Island are a large and ungainly set of documents. They are seven volumes, and even the Executive Summary has a hundred pages, plus five appendices. It’s hard to know where to begin.

Here, then, is the beginning of an entirely desultory tour through the state budget—and the state budget documents. For the next several weeks, I’ll post an article every few days (and every Monday) about different parts of the budget, and eventually we should be able to get within shouting distance of most of it. Obviously some subjects will get short shrift, but there will be room to cover plenty of the controversies. I’ll monitor the comments for suggestions, directions, and corrections, and will happily accept them via email as well.

Through the same period, the House Finance Committee will be conducting hearings about the various pieces of the budget proposal, but they are unlikely to do anything about any of it until after the beginning of May, when the estimates come in for tax receipts and social service expenses.

Volumes

The budget documents have been rearranged slightly this year, and they consist of the following volumes (and my abbreviations).  All these are available at the link above:

  • Executive Summary (ES) contains text descriptions of the budget and its changes. It also has a description of the economic outlook, summary schedules, tables of municipal aid and education aid, and the planning values used.
  • Budget, volume I (B1) contains the budget for the General Goverment departments, like Administration and the Legislature, and the quasi-public agencies like RIPTA and the Airport.
  • Budget, volume II (B2) has all the Human Services agencies (Health, DCYF, and Behavioral Healthcare, Developmental Disabilities and Hospitals, and so on)
  • Budget, volume III (B3) covers all the Education departments, both Elementary and Secondary, and the state higher education institutions.
  • Budget, volume IV (B4) is for Public Safety, Transportation, and Natural Resources.
  • Capital Budget (C) has all kinds of exciting tables about how much is borrowed and what for.
  • The Technical Appendix (TA) is where dollar figures for detailed accounts are published, and includes the accounting codes, which helps when you want to get specific answers later.
  • There’s usually a small Budget as Enacted document that toddles along a month or so after the budget is passed. It’s not much more than a restatement of the schedules in the various department budgets; its numbers become part of the next year’s presentation.

In addition to these, the word “Budget” can also refer to the Appropriations Act itself. This is the law that actually gets passed by the legislature and signed by the Governor, and this year it’s been introduced to the House as bill 2012-H7323. All the numbers presented in the seven volumes are in Article 1, and the other articles contain the necessary legal changes to make the numbers work. Of course, the budget is a must-pass piece of legislation, so by the time the budget hits the floor of the House for debate, the articles will often include some hidden delights, too.

So let’s begin.

Austerity

To begin with, let it be clear from the outset that this is an austerity budget. Governor Chafee is getting lots of flack from the usual sources about his high spending and his tax increases, blah blah blah. What these people don’t want you to know is that this is a budget with many savage cuts in it. Chafee claims $45 million in program cuts in his transmission letter (beginning of ES), and the overall budget is down by 2.8%, to $7.943 billion from $8.173 billion in FY12. Federal funds are to be cut $271 million, largely due to the expiration of the stimulus funds.

For a little perspective, the state’s economy is expected to be a hair less than $50 billion in 2012, so the state budget is about 16% of everything. Municipal expenses add another $2 billion or so, so together we’re talking about a fifth of the state economy under very tight constraint. Recovery from our downturn can happen under these circumstances, but the austerity we’re seeing in government is roughly the opposite of stimulus, so it’s not as if the state is helping dig the economy out of its hole.

Why is the Governor’s budget so stingy? Because the Legislature told him that’s what they wanted. Last year, Governor Chafee proposed some changes in the sales tax to give his budget a modestly expansionary flavor. The state has to balance its budget, so we can’t do wholesale stimulus; the idea was only to keep from slashing everything, and to prevent a situation where government was laying people off during a recession. Any tax at all, of course, was anathema to the business “community” and the legislature duly shot it down, in peremptory fashion. House Speaker Gordon Fox essentially foreclosed the tax change before the budget even got to the behind-closed-door phase. So most towns enacted a property tax increase, and this year we have more austerity and cities going bankrupt. It’s really a pretty simple connection, even though lots of people want you to think it’s complex.

You have likely already heard lots of righteous-sounding arguments about how we ought to balance the government’s checkbook just like we balance a household’s. The analogy hides that fact that the austerity we feel is self-imposed, with much of it due to ill-advised tax cuts in the recent past.  Second, and more important, it would have us imagine that paving roads, jailing criminals, and providing universal public education is somehow comparable to buying groceries and paying rent. Yes, the accounting can be made to look similar, but does the analogy stretch any further than that? The benefit of my groceries goes to me. The benefit of public education and roads doesn’t accrue to the state government in any but the most indirect sense. There is a difference between public goods and private ones that the accounting cannot reach and that many fiscal “conservatives” apparently cannot see. But more about all of this further down the road.

Next: “Assistance, Grants, and Benefits” — 44.6% of the budget?