 Everyone knows that Rhode Island has the highest unemployment rate in the nation, right? After a few years of lagging Michigan and sometimes Nevada, we are now the nation’s leaders, despite the rate having ticked down slightly last month.
But consider this: what do you learn by comparing a tiny state like ours to relatively gargantuan states like Michigan and Nevada? Is that comparison useful? Huge parts of Nevada are desert; huge parts of Michigan are farms; there are no huge parts of Rhode Island. Could that be relevant to the three states’ economies?
Comparing states to each other is a decent way to get a handle on differing state policies, but do we think that state policies are at the heart of our high unemployment rate? Are there no other differences you can think of between, say, Texas and Rhode Island? I believe our state’s policies certainly contribute to our economic condition, but sometimes another analysis can be revealing, too.
I looked last week at the unemployment rates for metropolitan areas (“Metropolitan Statistical Area” or MSA), as defined by the Census Bureau, and learned that the Providence MSA (which includes what you think of as greater Providence, as well as stretching out to include Fall River) has unemployment of 9.7%, higher than the statewide rate. We rank 339 out of 372, a pretty dismal showing. But that’s not dead last, so I also learned that there are 32 MSAs in 11 different states that rank lower than ours, including New Bedford, at 11.1%, and bottoming out at Yuma, Arizona, at over 22%. And Westerly and Hopkinton are part of an MSA centered in Connecticut, and their rate is 7.9%, or number 268 on the list. Nothing to be proud of, but better than 104 other places.
Half of the MSAs in California are doing worse than we are, as are three out of five in New Jersey, and four out of 25 in Texas. But those states also contain some high-performing MSAs, so the devastating performance of some areas are washed out in the statewide averages. There are several one-party states in that mix — from both parties — as well as several with divided control of their governments. It seems to me that anyone who wants to claim that Rhode Island’s high unemployment rate is entirely due to state policy has the burden of explaining why we should adopt the tax and regulatory policies that have brought Brownsville, Texas to a 9.8% unemployment rate or Yuma to 22%.
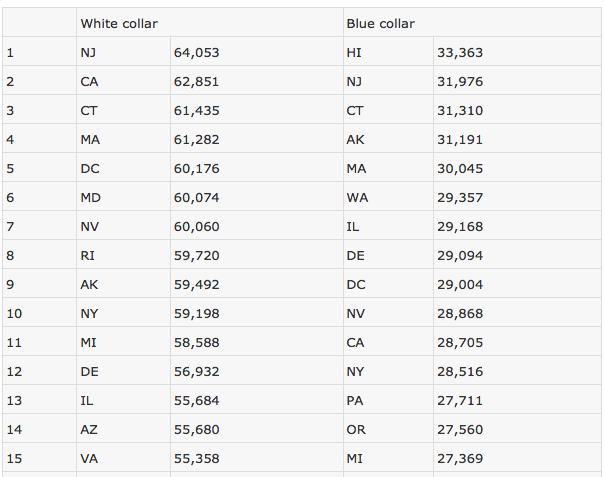
A few years ago I did an analysis that suggested the structure of the labor market might be relevant. Nestled between two richer states, Rhode Island’s white-collar jobs pay comparable wages to those neighbors. Jobs like these are good jobs, for which you might commute a long way, or even move your home. For jobs like being a psychologist, computer programmer, architect, or lawyer, this is pretty much a single job market. An employer in Warwick looking to hire a staff attorney competes for a pool of attorneys who might easily take a job in New London, Attleboro, Sharon, or Boston.
It’s not like that for hiring a cashier in a convenience store. You wouldn’t commute to Boston to work in a deli, and so it turns out that while white-collar wages here are at least comparable to wages for similar jobs in Massachusetts and Connecticut, blue-collar jobs vary much more, and in fact pay much worse here in Rhode Island.
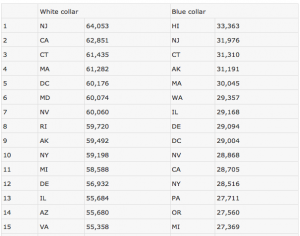
I made a couple of rankings of states based on a selection of job categories, and I learned that some areas ranked high on my white-collar job list and low on my blue-collar list, while in some it was the other way around. (Read more about them in my book, “Ten Things You Don’t Know About Rhode Island.” The table is below, but you’ll have to check out the book to get all the details.)
In truth, I have no idea why these rankings differ, though it is entertaining to speculate. I noticed, for example, that places with a long history of union manufacturing (Ohio, Pennsylvania) pay good blue-collar wages, even for non-manufacturing jobs, and places that are very attractive to live (Hawaii, Oregon) tend to pay relatively poor white-collar wages. Agricultural areas tend to pay poor blue-collar wages, even for non-agricultural jobs. Rhode Island, with high white-collar wages and very low blue-collar wages, is an anomaly in the Northeast, and belongs with the states of the South, Southwest, and California.
Here’s what else I notice: the places that pay the worst blue-collar wages dominate the high end of the unemployment ranking.
This seems counter-intuitive — why would lower wages mean higher unemployment? — but it also seems to be true. On closer examination, maybe it’s not so crazy. People at the low end of the income spectrum tend to spend the money they have because they have to. More money in those people’s hands means more money being spent, so it makes sense that an area with better-off low-wage workers will enjoy higher levels of economic activity. This is just speculation, but it is broadly consistent with the basic Keynesian model of the economy that dominates our economic discourse.
But we can go one step farther, too. If we want to bring state policy into the equation, it seems that the metropolitan areas with the highest unemployment are not only places with low blue-collar wages, but are often in states where taxes on the low end of the wage scale are relatively high. According to the Institute for Taxation and Economic Policy (ITEP), Texas, Arizona, Illinois, and New Jersey are all places where total state and local taxes on the poorest people approach or top 12%, just like here. In other words, these are largely places where poor people are paid badly and taxed at high rates, too.
ITEP tells us that state and local taxes on poor people in Rhode Island average 12.1% of their income, while for people in the top 1%, the average rate is 6.4%. The tax cuts for the rich that we have given year after year have not resulted in lower taxes all around. Rather what has happened is that the state simply shirked its responsibilities to education and local aid. The cities and towns took up the slack by raising their property taxes, which fall most heavily on those with the least ability to pay. Taking money away from people who are most likely to spend it is what you might call the opposite of economic stimulus, so it is little surprise that the result is what you might call the opposite of prosperity.
What could we do about this? Pushing up the minimum wage would be a start. Cracking down on wage theft and the mis-classification of employees might help, too, as well as finally being honest about what we’ve been doing to our cities and towns.
Just something to think about when you read about the unemployment rate. As usual, it seems the things that everyone knows sometimes get in the way of understanding what’s going on.
|
White collar |
Blue collar |
| 1 |
NJ |
64,053 |
HI |
33,363 |
| 2 |
CA |
62,851 |
NJ |
31,976 |
| 3 |
CT |
61,435 |
CT |
31,310 |
| 4 |
MA |
61,282 |
AK |
31,191 |
| 5 |
DC |
60,176 |
MA |
30,045 |
| 6 |
MD |
60,074 |
WA |
29,357 |
| 7 |
NV |
60,060 |
IL |
29,168 |
| 8 |
RI |
59,720 |
DE |
29,094 |
| 9 |
AK |
59,492 |
DC |
29,004 |
| 10 |
NY |
59,198 |
NV |
28,868 |
| 11 |
MI |
58,588 |
CA |
28,705 |
| 12 |
DE |
56,932 |
NY |
28,516 |
| 13 |
IL |
55,684 |
PA |
27,711 |
| 14 |
AZ |
55,680 |
OR |
27,560 |
| 15 |
VA |
55,358 |
MI |
27,369 |
| 16 |
GA |
55,323 |
MN |
26,989 |
| 17 |
HI |
55,231 |
CO |
26,900 |
| 18 |
CO |
55,141 |
MD |
26,848 |
| 19 |
NC |
54,849 |
IN |
26,777 |
| 20 |
TX |
54,734 |
OH |
26,724 |
| 21 |
OR |
54,552 |
NH |
26,406 |
| 22 |
PA |
54,415 |
MO |
26,152 |
| 23 |
TN |
54,110 |
RI |
25,994 |
| 24 |
WA |
54,105 |
VA |
25,913 |
| 25 |
MN |
54,096 |
WI |
25,903 |
| 26 |
WV |
53,906 |
KS |
25,728 |
| 27 |
OH |
53,878 |
AZ |
25,445 |
| 28 |
WI |
53,769 |
TN |
25,396 |
| 29 |
FL |
53,269 |
IA |
25,294 |
| 30 |
IN |
52,910 |
GA |
25,153 |
| 31 |
MO |
52,649 |
WY |
24,968 |
| 32 |
NH |
52,622 |
VT |
24,708 |
| 33 |
UT |
52,536 |
NE |
24,635 |
| 34 |
ID |
52,128 |
ID |
24,611 |
| 35 |
MS |
51,840 |
SC |
24,333 |
| 36 |
AL |
51,311 |
UT |
24,299 |
| 37 |
ME |
51,104 |
MT |
24,161 |
| 38 |
SD |
50,725 |
ME |
24,075 |
| 39 |
AR |
50,489 |
LA |
24,004 |
| 40 |
LA |
49,971 |
NC |
23,983 |
| 41 |
WY |
49,790 |
KY |
23,967 |
| 42 |
VT |
49,734 |
SD |
23,850 |
| 43 |
SC |
49,478 |
ND |
23,841 |
| 44 |
NM |
49,132 |
OK |
23,753 |
| 45 |
KY |
48,838 |
TX |
23,502 |
| 46 |
IA |
48,564 |
FL |
23,466 |
| 47 |
OK |
48,361 |
WV |
23,353 |
| 48 |
ND |
48,171 |
NM |
22,634 |
| 49 |
NE |
48,039 |
AR |
22,562 |
| 50 |
KS |
47,308 |
AL |
22,428 |
| 51 |
MT |
46,128 |
MS |
22,097 |
(Source: SalaryExpert.com, 2005 data, methodology described here)

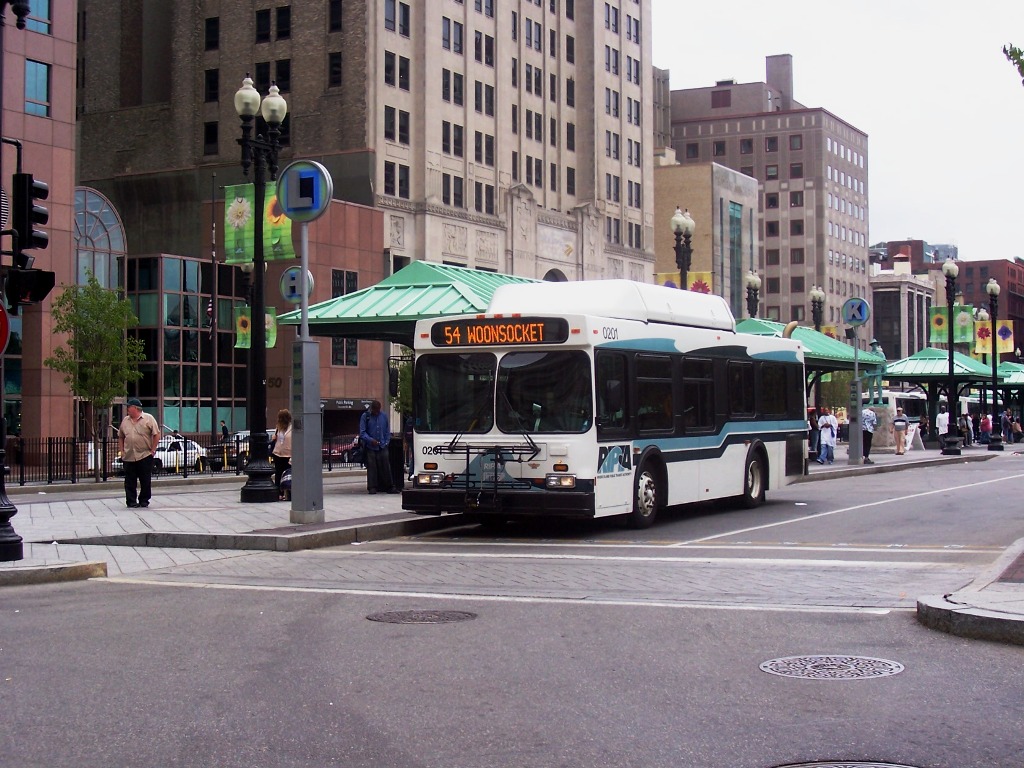 I saw my friend Jeff yesterday morning, on the way to his morning workout at the YMCA. Jeff is confined to a wheelchair, and uses RIPTA to get to the East Side Y most mornings. We chatted for a few minutes while we got on the same bus and shared it through the bus tunnel.